Figure 2.

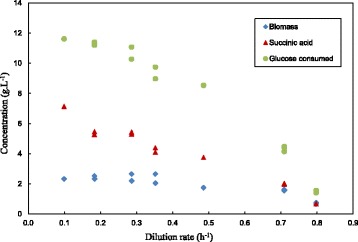
Chemostat steady-state measurements of ΔGlc, SA and biomass plotted against D. High shear conditions prevented biomass attachment. Extrapolation of data indicates that μmax lies between 0.8 h−1 and 0.85 h−1.

Chemostat steady-state measurements of ΔGlc, SA and biomass plotted against D. High shear conditions prevented biomass attachment. Extrapolation of data indicates that μmax lies between 0.8 h−1 and 0.85 h−1.