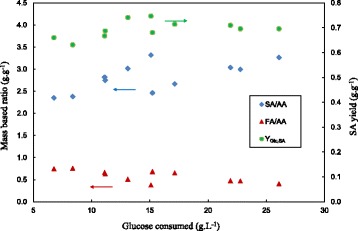
Figure 7.

Biofilm reactor mass-based yield ratios (SA/AA, FA/AA and Y Glc,SA ) plotted against ΔGlc. When compared to the comparative graph for the chemostat (Figure 3), the YGlc,SA is significantly higher (up to 50% more). The SA/AA ratio of the biofilm runs is more than double that of the chemostat runs (Figure 3). The FA/AA ratio is close to equimolar (0.77 g.g−1) at low ΔGlc but decreases with increasing ΔGlc.
