Figure 1.
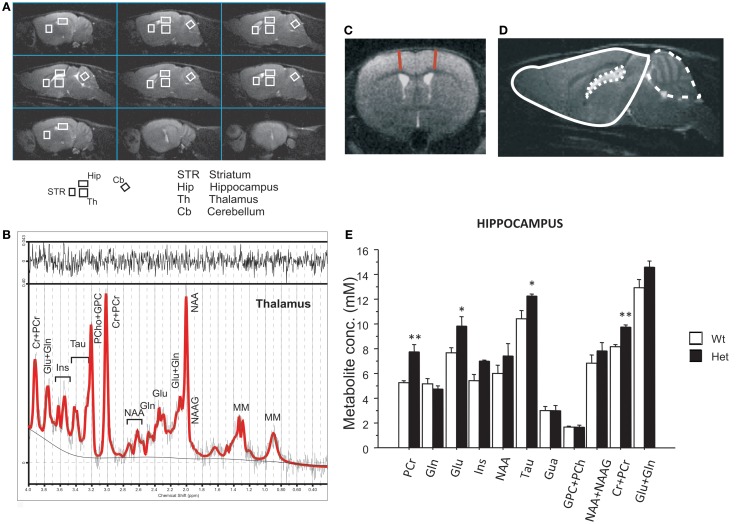
Magnetic resonance imaging and spectroscopy performed in 4-month-old reeler mutant mice. (A) MRI panel – example of in vivo sagittal T2-weighted spin-echo images (TR/TE = 3000/70 ms, slice thickness 0.8 mm, NS = 2, FOV = 20 mm × 20 mm, matrix 128 × 128). Voxels localized on STR, Hip, Th, and Cb are indicated by the white rectangles. (B) MRS panel – examples of in vivo 1H spectra (as a black trace), acquired from the thalamus (PRESS, TR/TE = 4000/23 ms, NS = 256). The result of LCModel fit is shown as a red trace superimposed on the spectrum. Metabolite assignments: Ins, inositol; Cr, creatine; PCr, phospho-creatine; Glu, glutamate; Gln, glutamine; Tau, taurine; PCho, phospho-choline; GPC, glicero-phospho-choline; NAA, N-acetyl-aspartate; NAAG, N-acetyl-aspartyl-glutamate; MM, macromolecules. (C) Examples of axial fast T2-weighted MR images from reeler heterozygous (Het) mice, respectively (TR/TEeff = 3200/60 ms, ns = 4, slice thickness 0.6 mm, 24 slices, matrix 256 × 256, FOV = 25 mm × 25 mm, which correspond to voxel resolution of 98 × 98 × 600 μm3). The red lines show the motor cortex thickness measure. (D) Example of brain segmentation for volumetric analyses of brain (plain line), cerebellum (dashed line), and ventricles (dotted line). (E) The histogram shows metabolite concentrations in hippocampus (Hip) for the two groups. Data are expressed as mean + SEM, *P < 0.05, **P < 0.005 between wildtype and heterozygous reeler mice. N = 7 Wt and N = 7 Het.

