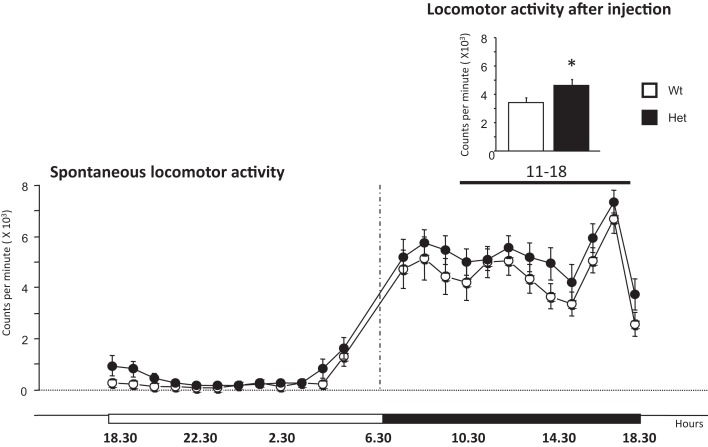
Figure 3.
Locomotor activity expressed spontaneously in the home-cage by 6-month-old wildtype and heterozygous reeler male mice. The main graph indicates spontaneous locomotor activity monitored for 1 week. The graph on the top right shows the spontaneous locomotor activity monitored for 7 h after a mild stressful stimuli represented by a saline injection at 11 h (dark phase). Data are expressed as mean ± SEM, *P < 0.05, between wildtype and heterozygous reeler mice. N = 9 Wt and N = 10 Het.

