
Table 3.
Comparison of feature extraction approaches in terms of classification performance.
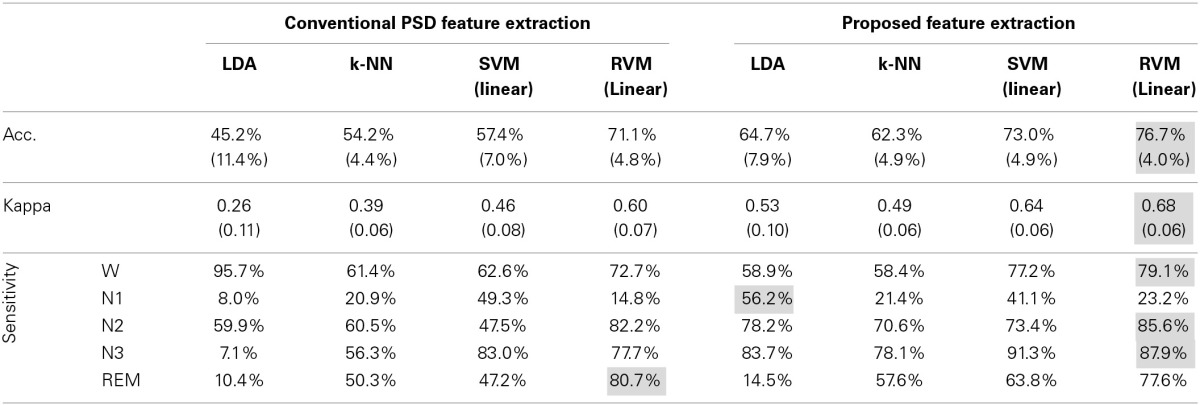
Each lattice represents the mean value of the validation index from ten subjects, and the corresponding bracket is the standard deviation. Acc. and kappa represents overall accuracy and Cohen's kappa coefficient, respectively. Highlighted parts display the optimum performance of all comparison results.