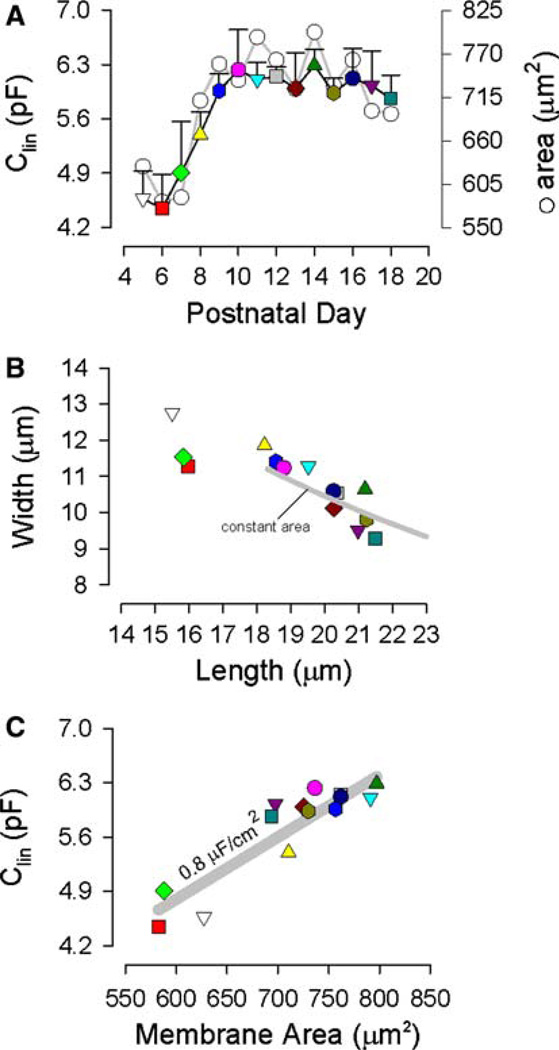
Fig. 2.
Cell dimensions as a function of postnatal day. (A) Linear capacitance (with standard error bars) and surface area as a function of postnatal day. Note saturation of each measure at P10. (B) Inverse relationship between measured length and width of OHCs. Solid gray line denotes constant surface area constraint on width vs. length for the cylindrical model (see Materials and Methods). Surface area was constrained at 740 µm2 (P10). (C) Relationship between linear capacitance and calculated surface area. Solid gray line denotes a specific membrane capacitance of 0.008 pF/µm2

