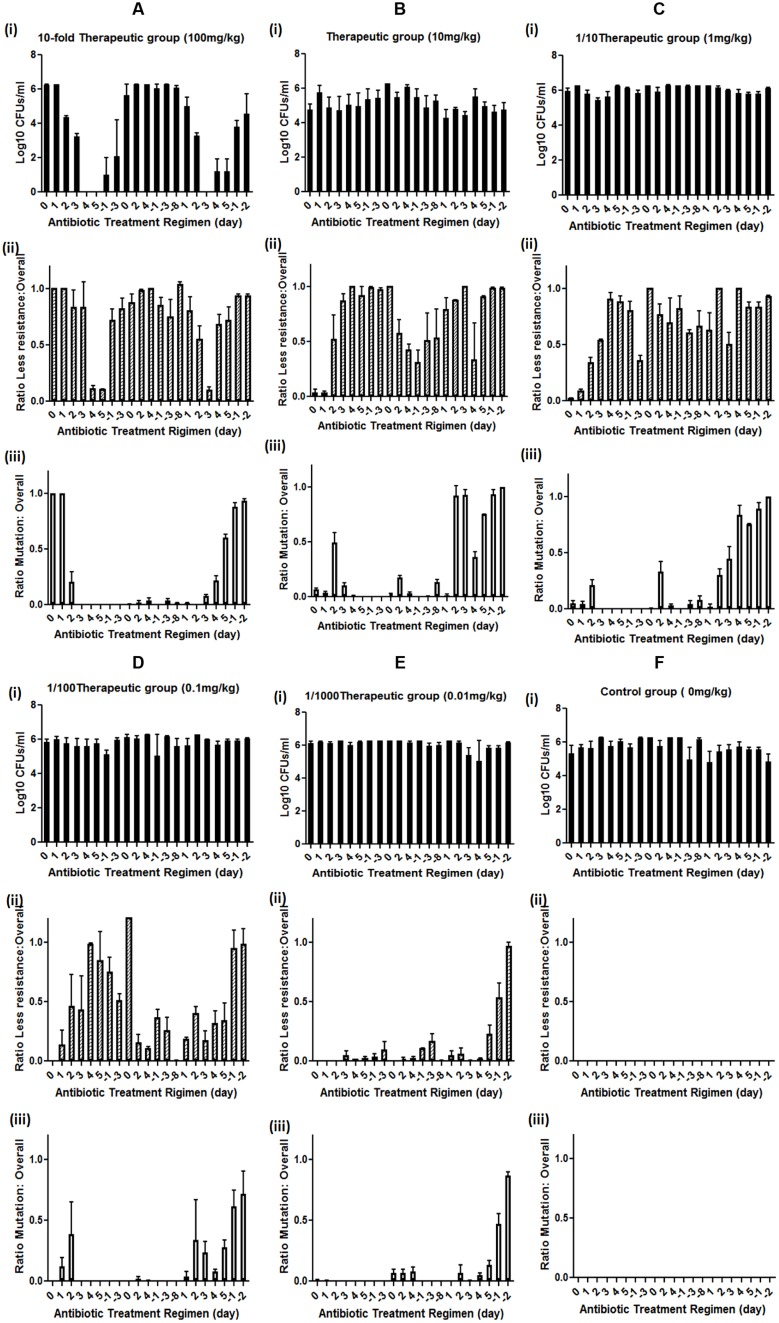
FIGURE 1.
Effect of different doses of enrofloxacin treatment on mutation development in rat GI tract E. coli. (A) high dose (10-fold therapeutic dose) enrofloxacin treatment, (B) therapeutic dose of enrofloxacin treatment, (C) sub-therapeutic dose (1/10 of therapeutic dose) of enrofloxacin treatment, (D) Low dose (1/100 of therapeutic dose) enrofloxacin treatment, (E) very low dose (1/1000 of therapeutic dose) of enrofloxacin treatment, (F) Control group; (i) Levels of rat GI tract E. coli during enrofloxacin treatment; (ii) levels of less susceptible (grown on MacConkey supplemented with 0.125 mg/L of enrofloxacin) GI tract E. coli during enrofloxacin treatment; (iii) Levels of rat GI tract E. coli with target mutation (grown on MacConkey supplemented with 0.5 mg/L of enrofloxacin) during enrofloxacin treatment. Y-axis represents the ratio between less susceptible E. coli or E. coli with target mutation versus overall GI tract E. coli. Positive day number represents the antibiotic treatment duration, negative day number represents the duration since the cessation of antibiotic, 0 represents the day of the application of antibiotic and the fecal E. coli were isolated before the antibiotic treatment at day 0. The number is the average of data from five rats in the group.

