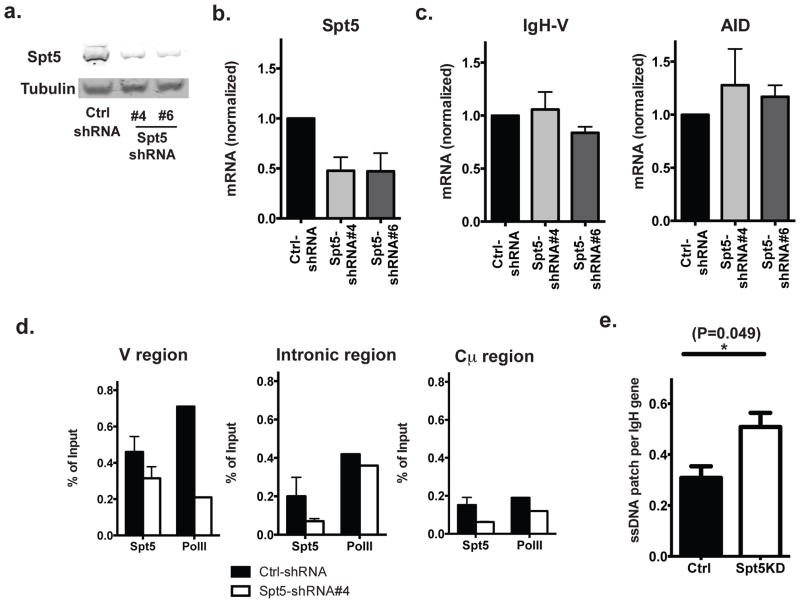
Figure 2. Decrease in the cellular Spt5 level is associated with more ssDNA patches.
a) Western blot; and b) quantitative PCR analysis of Spt5 protein and mRNA level (normalized by cyclophilin B expression) in cells transduced with indicated shRNA(s); c) Quantitative PCR analysis of mRNA levels of IgH and AID in cells either transduced with control shRNA constructs or indicated shRNA against Spt5; d) ChIP was conducted for Spt 5 and Pol II on cells either transduced with control (Ctrl) shRNA or shRNA #4 against Spt5 and ChIP products were quantified by quantitative PCR at the indicated region of Igh gene. e) Abundance of exposed ssDNA patches was quantified using native bisulfite conversion method (see Methods) followed by DNA sequencing. Data represent 4 independent experiments for part a and 2 independent experiments for part d (the error bars in this case are the variation in the duplicate PCRs in that experiment wherever applicable). Part b and c represent the average of at least 3 independent experiments. Part e represents a compiled analysis from two independent experiments using t-test and error bars represent the SD.

