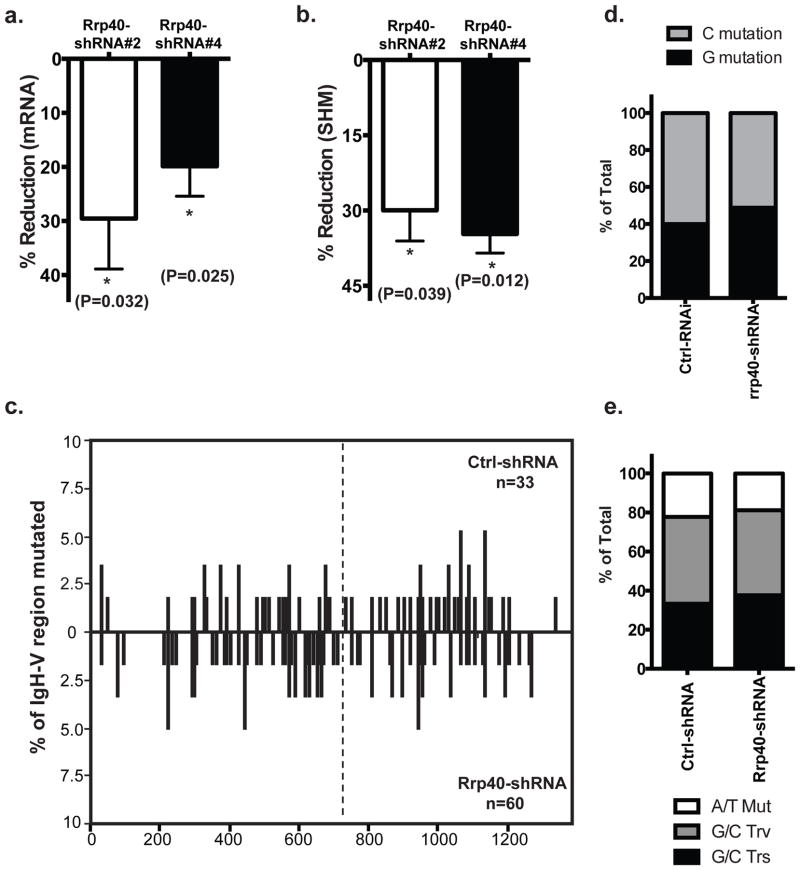
Figure 5. RNA exosome and SHM.
Knockdown efficiency of Rrp40 was assessed by quantitative PCR and percentage of reduction was calculated comparing to Ctrl-shRNA transduced cells; b) SHM rate was assessed in Rrp40 knockdown cells and Ctrl-shRNA transduced cells in the Ramos reporter cells and the reduction of SHM level was calculated accordingly. Combined data from three independent experiments were used to detect significant reduction associated with a reduced level of cellular Rrp40; c) Distribution of mutations in cells either transduced with control shRNA or shRNA against Rrp40 were analyzed by SHMTool. Data represent the compiling analysis from two independent sequencing experiments; d) G or C mutation frequency and e) mutation type were summarized in cells under the indicated conditions. A total of 33 Igh-V sequences were sequenced from Ctrl-shRNA transduced cells and 60 from Rrp40KD cells. A compiled analysis of 3 independent experiments was conducted in panels a and b using t-test and error bars represent the SD. 2 by 2 contingency table analysis were used for statistical analysis in d and e.

