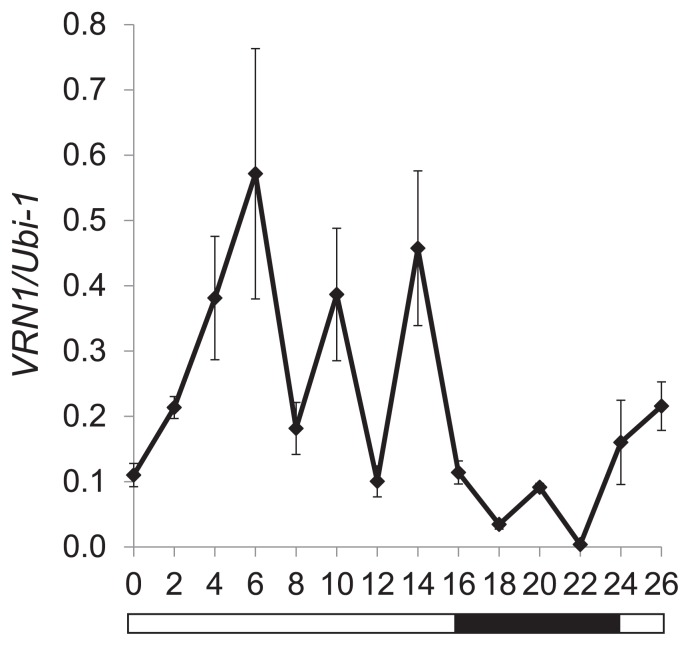
Fig. 3.
Diurnal expression pattern of VRN1 in spring wheat KU104-1 under long day conditions. The level of VRN1 expression was analyzed by real-time PCR using non-vernalized seedlings at the 7-leaf stage. The Ubiquitin (Ubi-1) gene was used as an internal control for calculating the relative levels of VRN1 genes. Each point indicates means and standard errors. The white and black bars along the horizontal axis represent light and dark periods, respectively.

