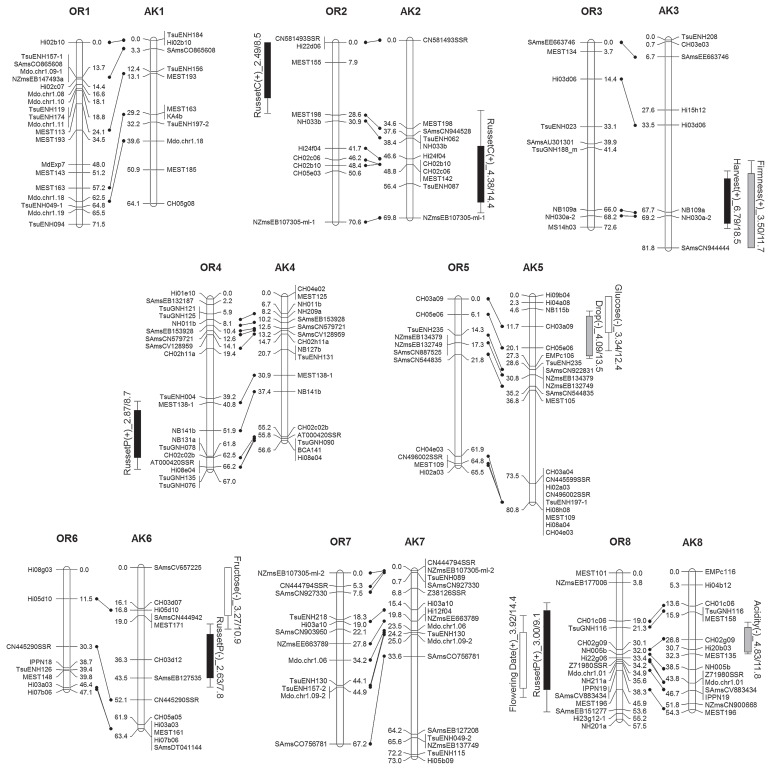
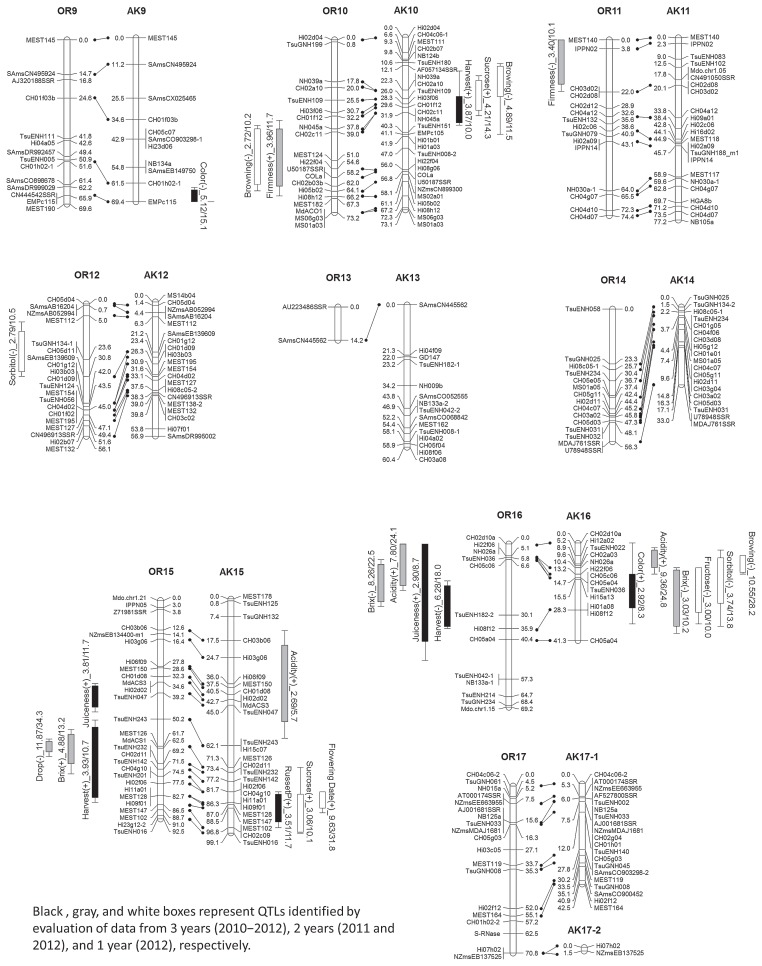
Fig. 1.
Genetic linkage maps for ‘Orin’ (OR) and ‘Akane’ (AK), and overview of the significant QTLs identified in each map. Numbering and orientation of the LGs follows that in the apple reference map (Liebhard et al. 2003a). The significant QTLs are shown to the side of each LG, with boxes and range lines indicating 1-LOD and 1.5-LOD support intervals. The direction of the allelic effect is indicated by (+) or (−), and represents the effect of the allele derived from ‘Golden Delicious’ compared to the effect of the allele derived from ‘Indo’ in the ‘Orin’ map, or the effect of the allele derived from ‘Jonathan’ compared to the effect of the allele derived from ‘Worcester Pearmain’ in the ‘Akane’ map. LOD and the proportion of the phenotypic variance explained are presented after the QTL name as LOD/proportion (%). The following traits are represented by abbreviations: russet on the calyx side (RussetC), russet on the pedicel side (RussetP), depth of skin color (Color), preharvest fruit drop (Drop), and juice browning (Browning).


