FIGURE 1.

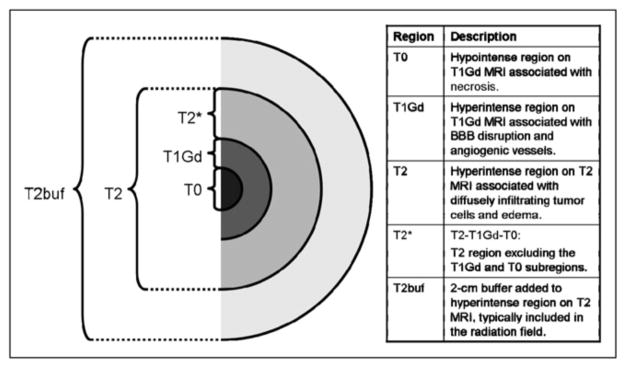
Schematic of tumor regions visible on T1Gd and T2. Table lists associations between MRI scans and schematic. T2buf = T2 buffer region.

Schematic of tumor regions visible on T1Gd and T2. Table lists associations between MRI scans and schematic. T2buf = T2 buffer region.