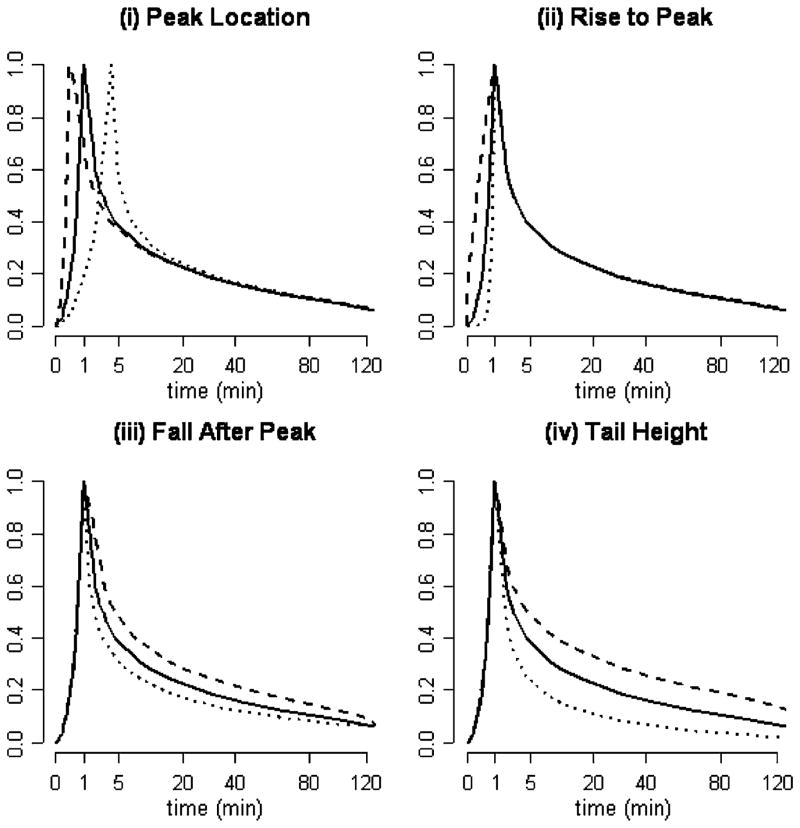
Fig. 1.
Illustration of the AIF model Cp(t|θ) [(3)] with different choices for θ = (ρ, αr, αf, κ). The solid black curve is the template C̄p(t). (a) ρ = 0.25 (dashes) versus ρ = 4 (dots). (b) αr = 0.25 (dashes) versus αr = 4 (dots). (c) αf = 0.5 (dashes) versus αf = 2 (dots). (4) κ = 0.75 (dashes) versus κ = 1.5 (dots).

