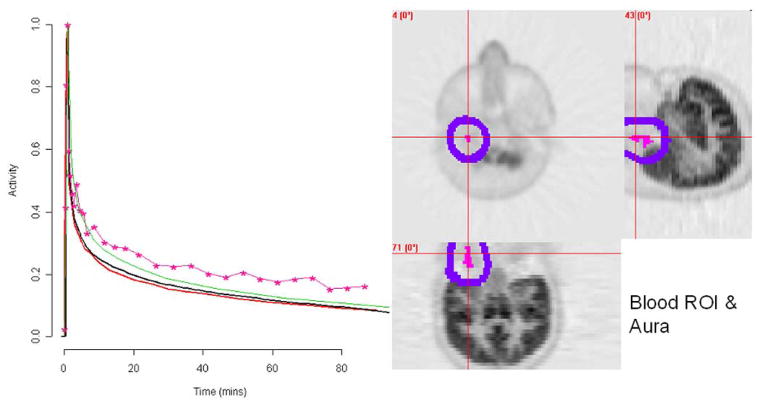
Fig. 4.
Normal subject illustration (9 in Fig. 6). Left: The radially sampled arterial AIF (A, red), penalty estimate (P, black), template (S, green) and segmentation (S, pink). The spillover correction (averaged over all blood region voxels) is shown in blue. Right: FDG uptake (grey) on transverse, sagittal and coronal slices centered in the region of the blood ROI (pink) identified by segmentation. The aura of the blood ROI is indicated (blue).

