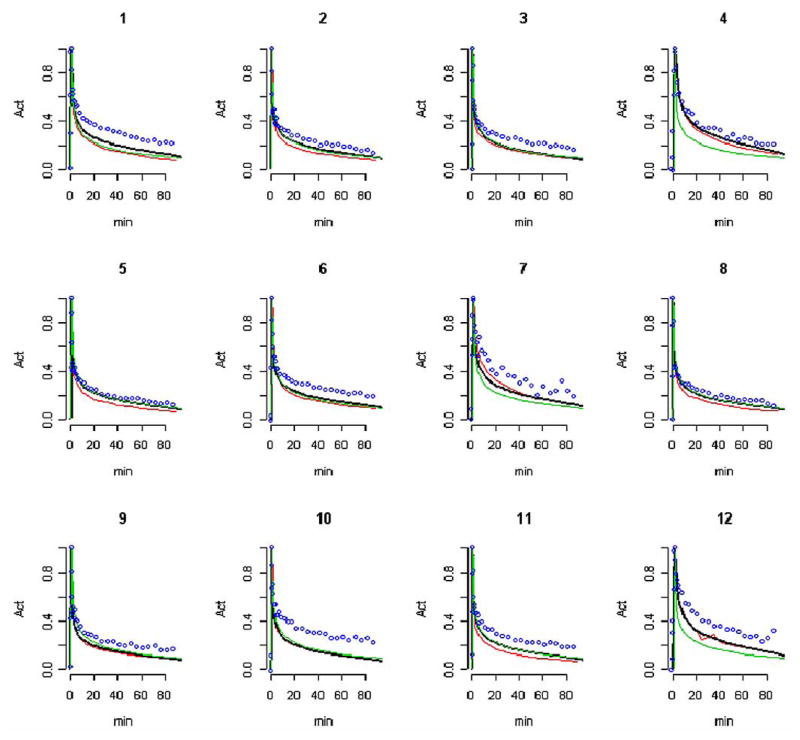
Fig. 6.
AIF extracted from dynamic cerebral FDG studies in normal subjects (labeled 1–12). The radially sampled arterial AIF (red), penalty estimates AIF (P, black), segmentation AIF (S, blue dots) and the population template AIF (S, green) are shown. Curves are aligned to have their maximums coincide with the arterial curve and are normalized to have a maximum of unity.

