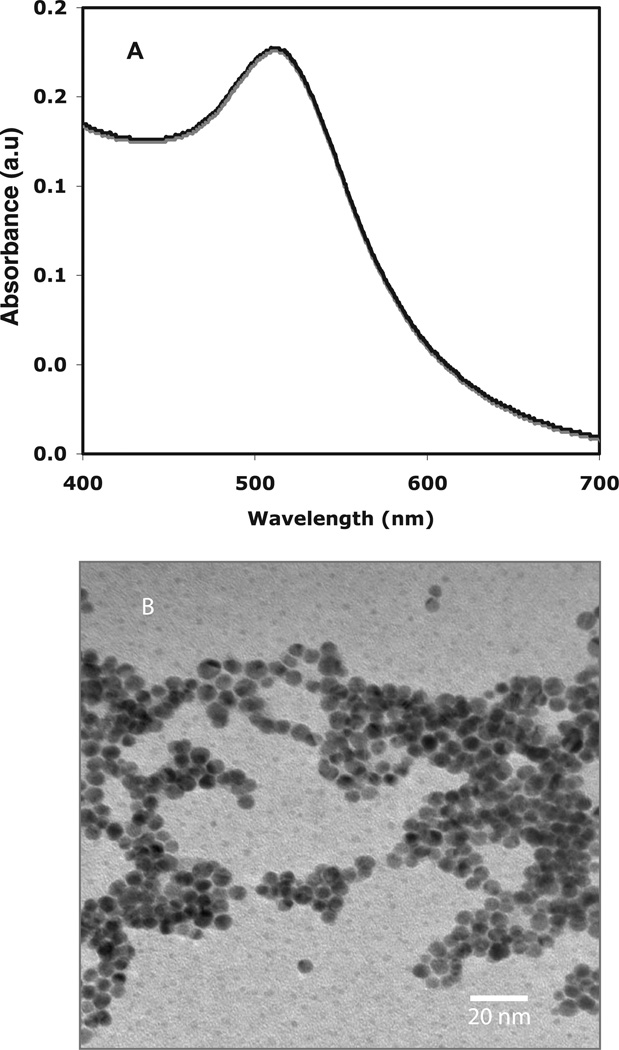
Figure 1.
UV–visible spectroscopy and TEM of AuNPs. (A) UV-visible spectrum of a colloidal AuNPs solution shows a characteristic absorbance at 510 nm. Graphical representation, n = 3. (B) TEM picture of AuNPs was obtained after drop coating the AuNPs on carbon-coated copper grid depicting the shape and size of these gold nanoparticles to be spherical and <5 nm, respectively. Representative photomicrographs are from three independent experiments.

