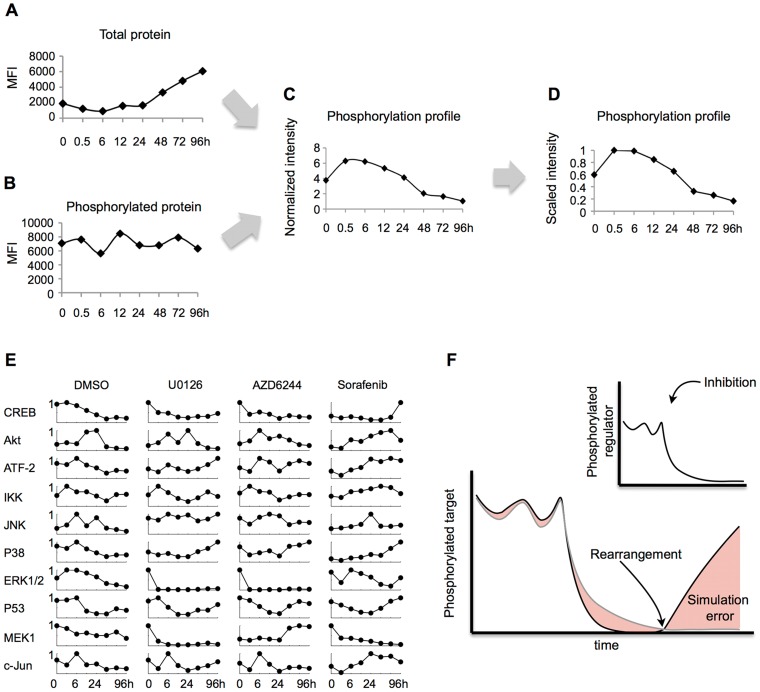
Figure 2. Strategy to study phosphorylation profiles in order to identify signaling rearrangements.
Using bead-based multiplex analysis, the total and phosphorylated protein levels of 10 MAPK-related signaling intermediates and transcription factors were measured simultaneously at 0, 0.5, 6, 12, 24 36, 48, 72 and 96 hours in A375, a melanoma cell line with a constitutive MAPK activation driven by the BRAF V600E mutation. As an example, (A) total ERK1/2 and (B) phosphorylated ERK1/2 are depicted (MFI: Mean Fluorescence Intensity). (C) Phosphorylated protein levels were normalized to total, to account for total protein loss. (D) To enable model fitting and comparison, measurements were scaled to maximum protein value for each condition. (E) Full normalized dataset. Rows represent intracellular readouts assayed. The first column was measured in control conditions (DMSO). Columns 2 and 3 were acquired upon MEK-specific pharmacological inhibitors U0126 and AZD6244. The last column was acquired after treatment with multi-kinase inhibitor Sorafenib. (F) Cartoon illustrating the modeling approach presented here to identify rearrangements. When treated with a specific inhibitor, the phosphorylation of a regulatory kinase (black curve, upper panel) should be inhibited. Consistently, its target (black curve, lower panel) should be down-modulated. If signaling is rearranged, the target should stop responding to regulatory behavior, and a mathematical model (grey curve) assuming the original situation should exhibit an error increase (red area under the curve). The model expresses the target as a function of the regulator or regulators, hence inhibition, e.g. a phosphatase-substrate interaction, could equally be captured and revealed to be lost by error increase.

