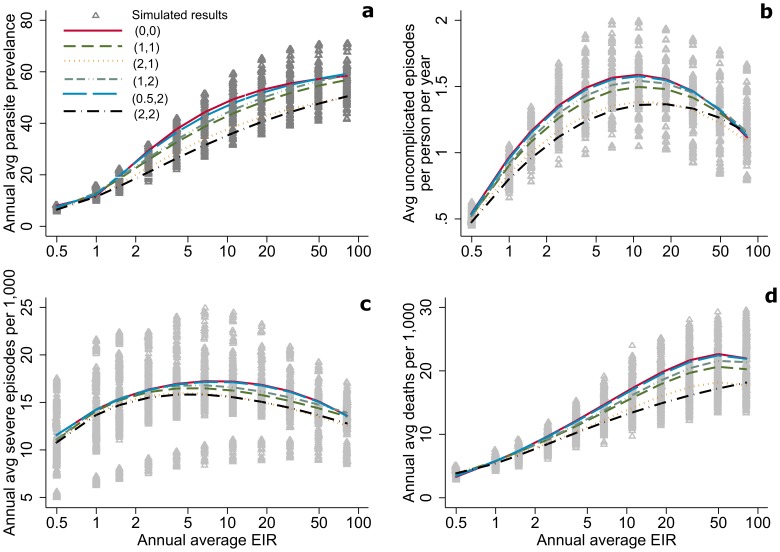
Figure 2. Relationship of parasite prevalence (a), uncomplicated episodes (b), severe episodes (c), and mortality (d) to annual average EIR by seasonality index (φ).
Triangles represent simulated results. The lines show the estimated relationship between indicators from the simulation runs, fitted using fractional polynomial regression, for each pattern of seasonality as described by (the seasonality index  , number of peaks) (
Figure 1
). Unbroken red line represents (0, 0). Brown dashed line represents (1,1). Orange dotted-dashed line represents (1,2). Green dotted line represents (2,1). Black dotted-dashed line represents (2,2). Blue dashed line represents (0.5, 2).

