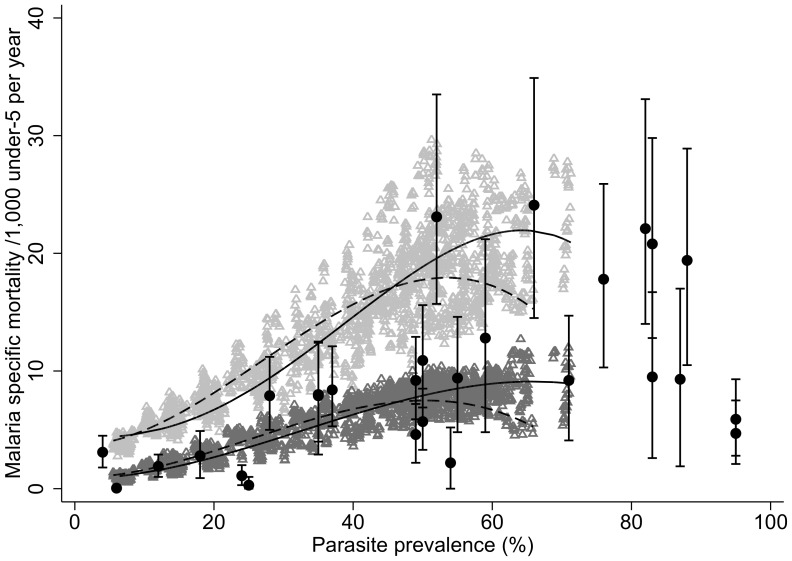
Figure 6. Relationship between mortality in children under 5 and average all-age parasite prevalence as described in Korenromp et. al [19] (black circles) and OpenMalaria simulations (triangles) for all deaths (light gray) and direct deaths only (dark gray).
Lines show the simulation-based estimated relationships with seasonality ( = 2, 2 peaks) (dashed) and without seasonality (φ = 0, 0 peaks) (unbroken) using fractional polynomial regression. The observed values from Korenromp et. al are results of verbal autopsy which do not specify direct malaria deaths as opposed to indirect malaria deaths.

