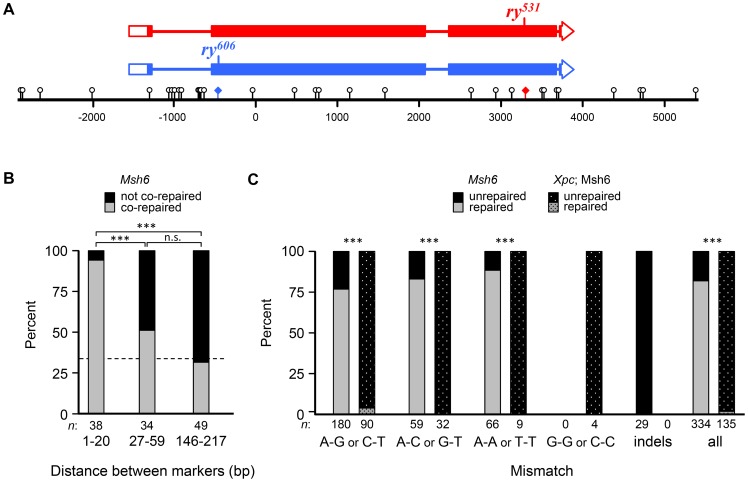
Figure 3. Short-patch co-repair frequencies are consistent with NER tracts.
(A) Schematic of the rosy locus used to recover tracts of hDNA. Boxes represent exons and filled regions denote coding sequences. Locations of mutants are indicated on the schematics and shown on the scale bar as colored diamonds. Markers used to map hDNA tracts are shown as lollipops on the scale bar (distances in base pairs, bp). See Materials and Methods for details. (B) Percentage of adjacent markers that are co-repaired and not co-repaired for different distances. Bars show the percentage in each class (gray, co-repaired; black, not co-repaired) for different ranges of distance between markers. The dotted line represents the expected frequency of co-repair if adjacent markers are repaired independently. The shortest distance class is within the range of NER excision tract size. (C) Frequency of repair of different mismatches in Msh6 and Xpc; Msh6 mutants. Bars represent percentage of each mismatch type that were repaired (gray) or unrepaired (black). Since DSBs likely occur at different, unknown sites, we cannot tell which of two possible mismatches was in the hDNA of the intermediate (though this can be inferred for trans hDNA in Xpc; Msh6 mutants). Msh6 data in (B) and (C) are from Radford et al. (2007b). NCOs that had full gene conversion with no unrepaired sites were not included, since these might arise through other mechanisms (see Figure S1); however, including these tracts did not change the outcome in either case. ***, P<0.0001; n.s., P>0.05 (two-sided Fisher's exact test).

