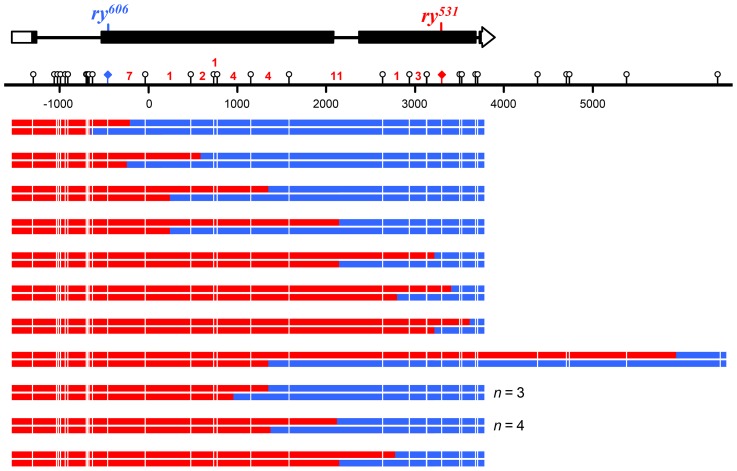
Figure 5. Crossovers from Xpc; Msh6 mutants.
At the top is a schematic of the rosy locus and the location of the mutant alleles used for purine selection (see Figure 3 and Materials and Methods). Each pair of lines below the scale represents the two strands of an independent crossover chromosome (red, sequence from ry531 chromosome; blue, sequence from ry606 chromosome). Markers used to map hDNA tracts are indicated with lollipops on the scale bar and white lines on the recombinants. Tract ends are shown as the halfway point between the last marker included in the tract and the first marker not included in the tract. All crossovers with detectable hDNA are shown. The number of crossovers without detectable hDNA that occurred within each interval are indicated in red numbers above the scale bar.

