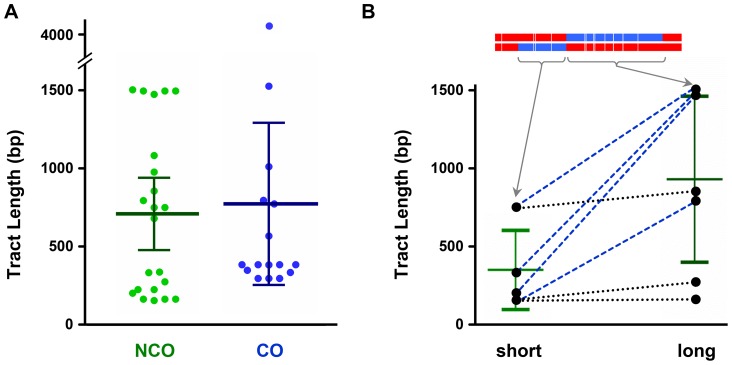
Figure 7. Comparison of hDNA tract lengths.
(A) Tract lengths from noncrossovers (NCO) compared to tract lengths from crossovers (CO). Each dot represents the maximum-likelihood size of on hDNA tract (see Materials and Methods). Bars indicate mean and 95% confidence intervals. The CO mean includes one exceptionally long CO tract (4198 bp), but the difference between NCO and CO was not significant regardless of whether this tract was included (P = 0.7985) or excluded (P = 0.2901). (B) Relationship between lengths of the two sides of trans hDNA NCO tracts. The shorter side of each is graphed on the left and the longer side on the right. One example is shown at the top, with arrows pointing to the length of the short and long sides (this example is the fifth NCO from the bottom in Fig. 4, reversed so the shorter end is on the left). Short and long sides from each individual tract are connected by lines: blue dashed lines, events in which short and long sides were markedly different; black dotted lines, events in which short and long sides were similar in length. Bars show means and 95% confidence intervals. The difference is modestly significant (P = 0.0261).

