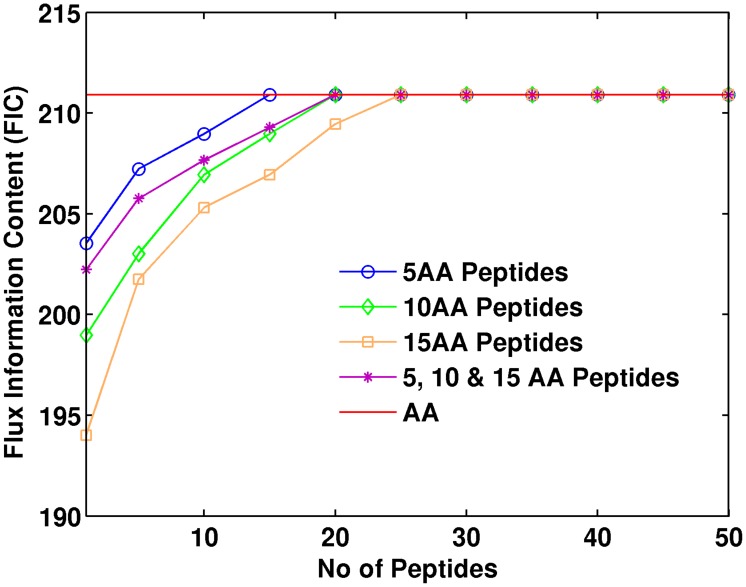
Figure 6. Flux Information Content (FIC) for the amino acid and peptide-based 13C MFA.
The upper red line indicates the FIC for the amino acid-based method, the target. The different lines represent how the FIC grows as we add the labeling information of more peptides, therefore constraining fluxes more effectively. Each line corresponds to peptides of different length: 5, 10 and 15 amino acids long and, finally, a set of peptides of mixed lengths. As can be observed, the smaller the peptide the more FIC in the data set, with the mixed group being an interpolation between the 5 and 10 aa curves. This is not surprising in light of the intuitive argument for FIC loss given in Figure S2: the longer the peptides the more uncertainty there is about where the MDV is coming from. However, for all peptide lengths studied here there is a number of peptides that counter this information loss and makes peptide-based 13C MFA as informative as the amino acid-based method. This number of peptides is under 30 for all cases.

