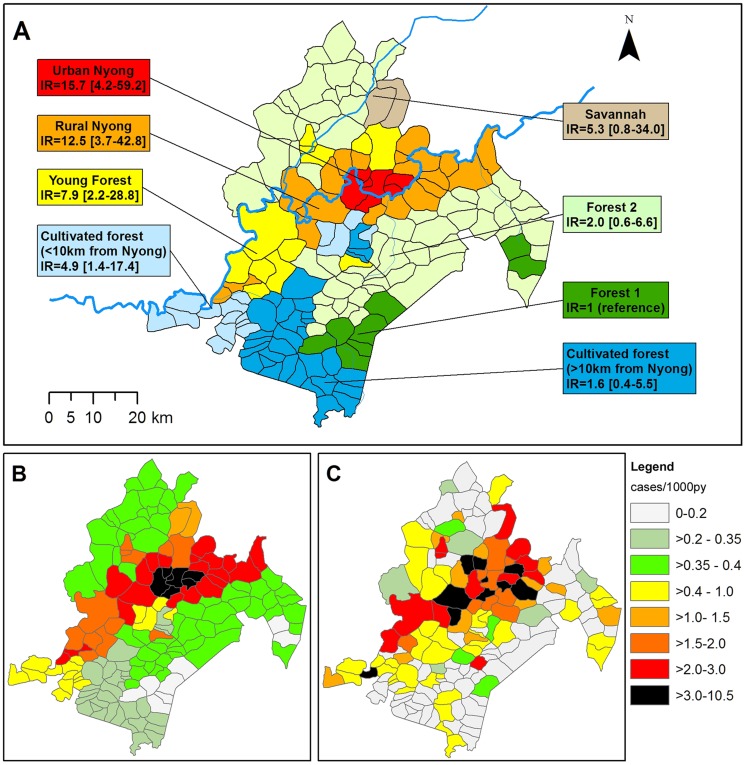
Figure 3. Landscape-associated risk of BU in Akonolinga district, 2002–2012.
A: Classification of Akonolinga area villages according to landscape group and associated BU incidence ratio with 95% confidence interval. B: Predicted cumulative incidence for each village of the district according to the landscape model (cases/1,000py). C: Observed cumulative incidence rate for each village of the district (cases/1,000py).

