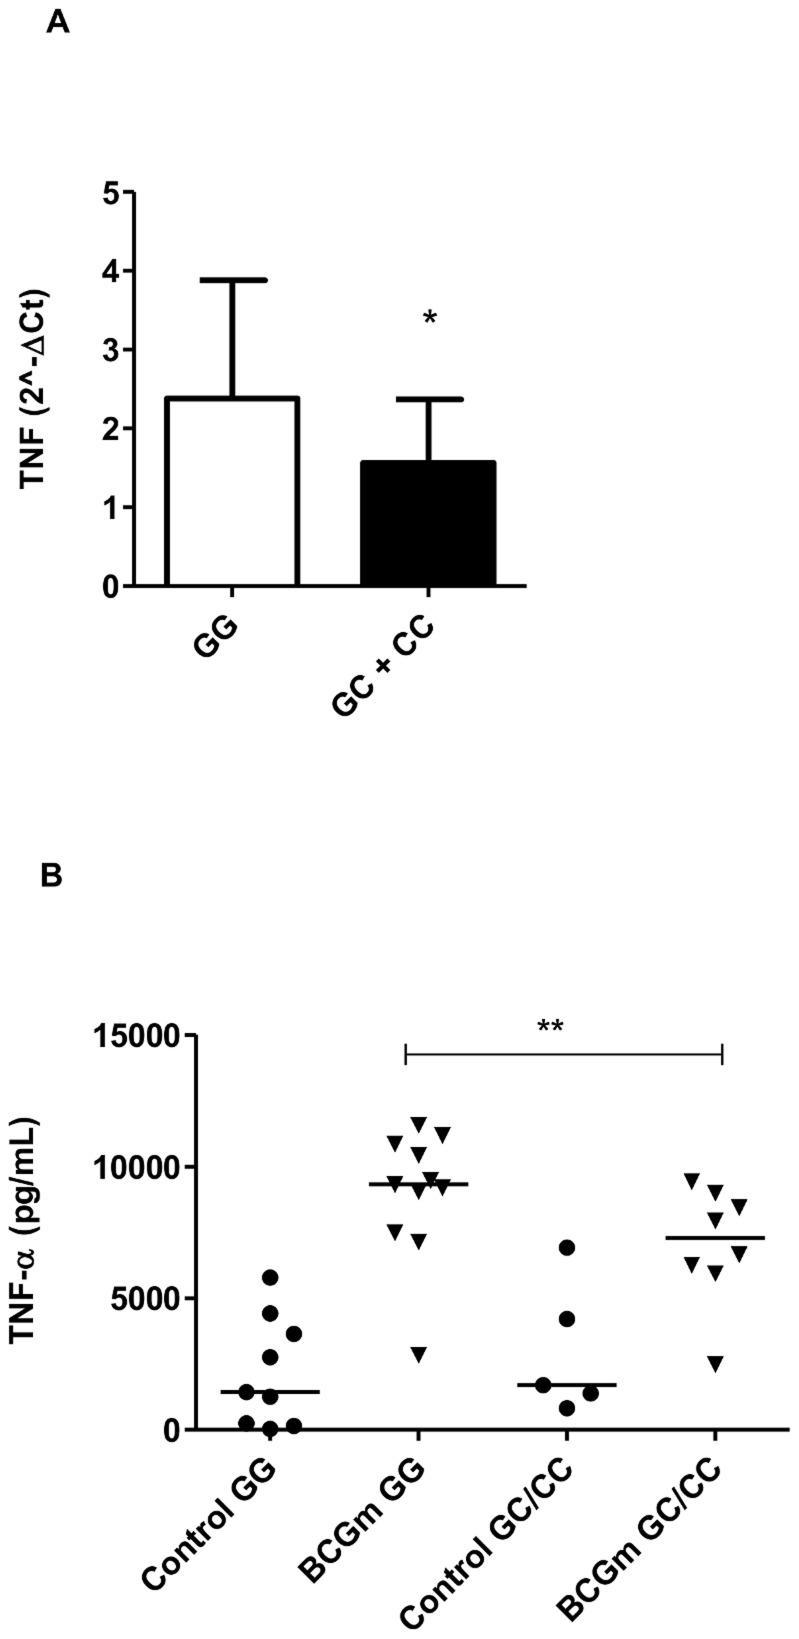
Figure 3. TNF expression and secretion according to the host genotypes (rs2910164).
(A) TNF expression from nerve biopsies was assessed by qRT-PCR after RNA isolation. Standardized expression values are shown. Control genotype (GG) = 12 and risk genotype (GC+CC) = 15. Data show the mean ± SEM (*p = 0.0453). (B) To assess TNF secretion, PBMC (3×10⁶ cells) were infected with BCG Moreau (BCGm) at a MOI 10∶1 for 24 h at 37°C. Supernatant was collected and TNF concentration (pg/mL) was estimated by ELISA. TNF levels produced by infected cells were significantly lower in C-allele carriers (risk variant) when compared with infected cells with GG genotype. Lines represent the median of each group and the dots represent individual PBMC donors. (**p = 0.0352).

