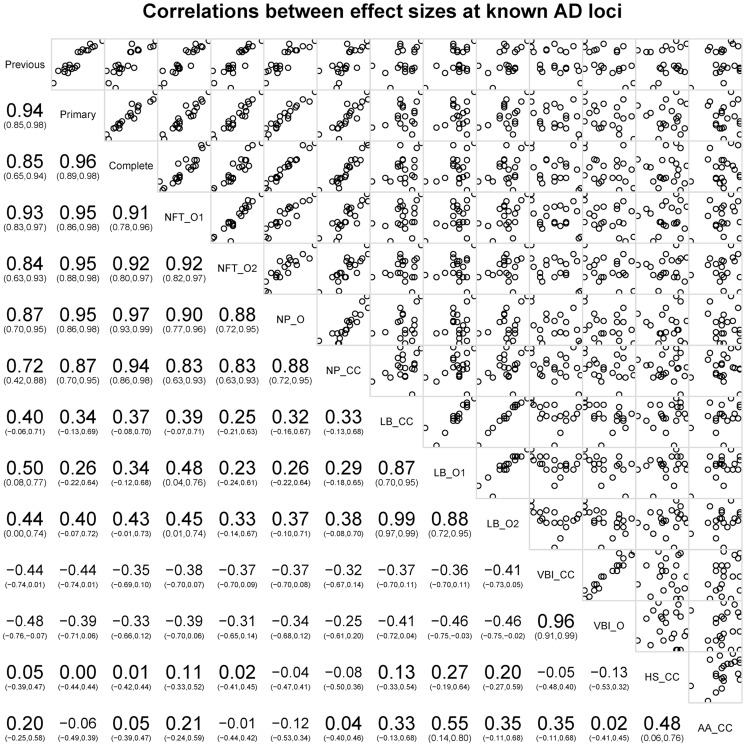
Figure 7. Correlations of OR for known AD risk loci and the neuropathology phenotypes.
Bottom left indicates the magnitude, direction, and confidence interval of the correlation. Top right shows plots of the data points against each other. The diagonal box indicates the phenotypes; off-diagonal boxes indicate the correlations of the OR for the corresponding phenotypes.

