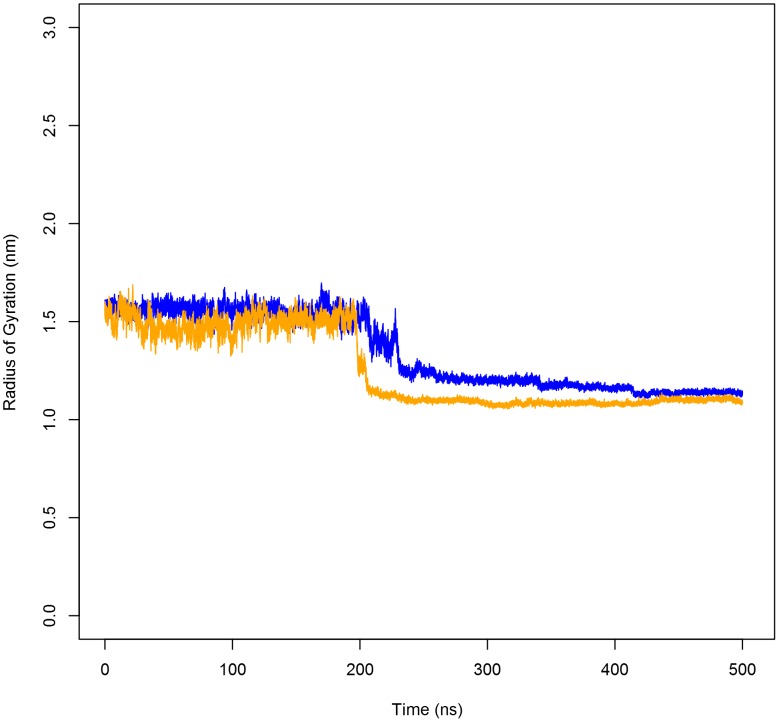
Figure 10. Radius of gyration (Rg) of the PSI over the time course of the simulations.
Rg of the PSI at pH 4.5 (blue line) and pH 7.4 (orange line) as a function of time. In either case, the PSI was free to move in the extended state. Upon adoption of a saposin-like fold, the collapse of the hydrophobic concave face of the PSI onto itself limits movement, thereby restricting water access to the hydrophobic core.

