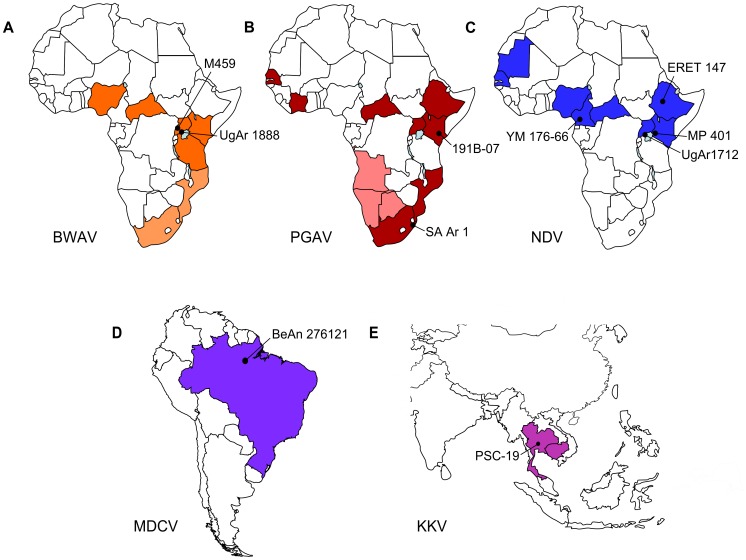
Figure 1. Geographic distribution of viruses used in this study.
Distribution of (A) Bwamba virus, (B) Pongola virus, (C) Nyando virus, (D) Mojuí dos Campos virus, and (E) Kaeng Khoi virus. Countries in which these viruses have been isolated (dark colors) and/or where specific antibodies to these viruses have been detected (light colors) are shown in orange (BWAV), red (PGAV), blue (NDV), purple (MDCV), and pink (KKV), respectively. The geographic location from which the virus strains used in the present study were isolated, are indicated with black dots. The strain names for these isolates are also indicated.

