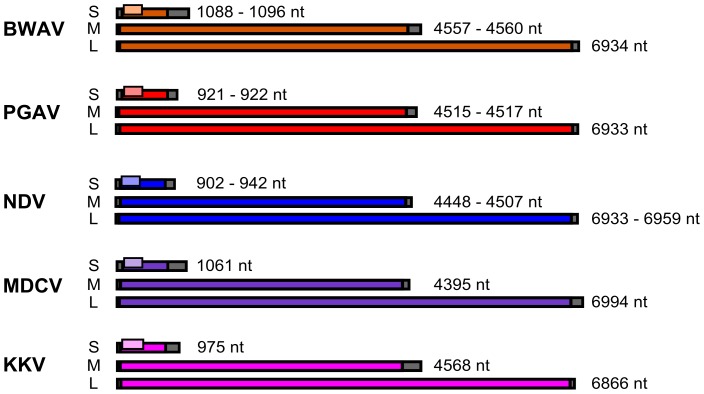
Figure 3. Comparison of virus genome structures.
The genomes of the various virus groups sequenced in this study are shown to scale. The non-coding regions are shown in grey while the major open reading frames encoded by each segment [S segment: N (ORF), M segment: GPC (ORF) and L segment: LORF)] are shown in colored boxes. The NSs protein, which is produced from a downstream ATG in the S segment, is shown in a lighter shade of the corresponding color for each virus. The total genome length of each segment is indicated at right.

