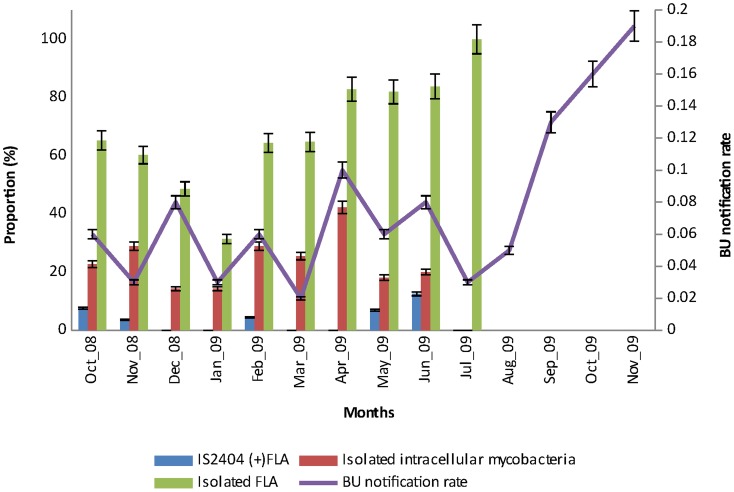
Figure 2. Proportions of FLA isolated from specimens, IS2404 detected in FLA cultures, mycobacteria isolated from an intracellular source over the sampling period (October 2008–July 2009) and BU notification rate until four months after the sampling period.
Error bars on the left Y-axis represent 95% confidence interval (CI) of the proportions of isolated FLA (68.3±1.66), IS2404 detected in FLA cultures (3.5±0.37) and intracellular mycobacteria (21.49±0.95) sampled monthly from environmental specimens (n = 539) for the specified period. Error bars on the right Y-axis represent the 95% CI of BU notification rate of the 5 endemic communities (0.08±0.04) with a population size of 6,296.

