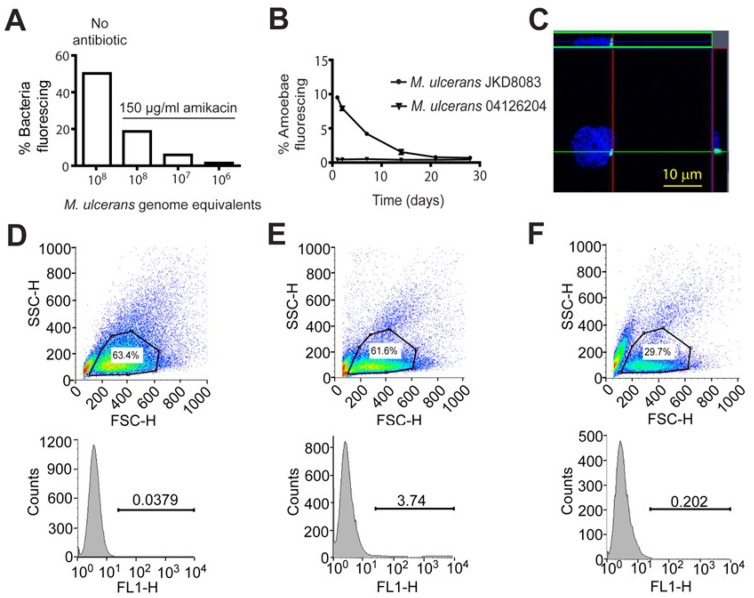
Figure 3. (A) Percentage of fluorescing bacteria present following growth at room temperature for 7 days in AC buffer supplemented with 150 µg/ml amikacin.
(B) Summary of flow cytometry data of A. castelanii infected with fluorescing (JKD8083) and non-fluorescing (04126204) M. ulcerans for 28 days. The mean percentage and SD of 3 biological repeats of fluorescent trophozoites at a MOI of 1 are shown. (C) Confocal microscopy demonstrating the intracellular location of M. ulcerans 3 hours post-infection in a DAPI stained trophozoite. Scale bar indicates 10 µm. (D–F) Representative FACS plots indicating forward scatter (x-axis) and side scatter (y-axis) following 7 days of co-incubation of amoebae alone (D), M. ulcerans JKD8083 (E) and M. ulcerans 04126204 (F). Lower panels show the gated trophozoites and FL1 fluorescence vs counts. Numbers refer to percentage of gated trophozoites fluorescing.

