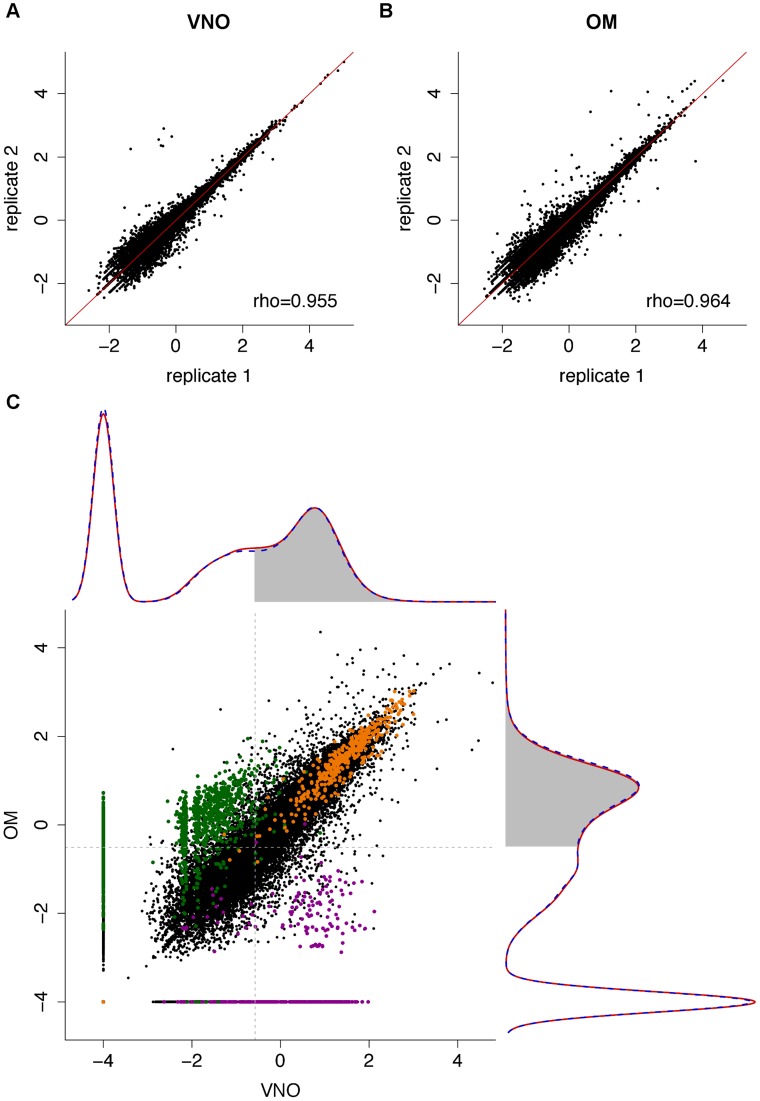
Figure 1. The transcriptomes of the VNO and OM.
(A–B) Representative scatter plots of the log10 FPKM values for all genes in two biological replicates for the VNO (A) and OM (B). Spearman correlations were computed and the rho values are indicated (see Figure S1 for all pairwise comparisons). (C) The VNO and OM transcriptomes show a bimodal distribution. Density curves were computed for the mean log10 FPKM expression values of males (dotted blue) and females (red); 0.0001 FPKM was added to avoid computing log10(0). The VNO is shown in the x-axis and the OM in the y-axis. The shaded region indicates genes that have a 0.25 or higher probability of being in the highly-expressed distribution. The scatter plot in the center depicts the expression levels of all genes in the VNO versus the OM. House-keeping genes (orange) tend to be expressed at high and similar levels in both tissues; OR (green) and VR genes (purple) are specifically expressed in their cognate tissue.

