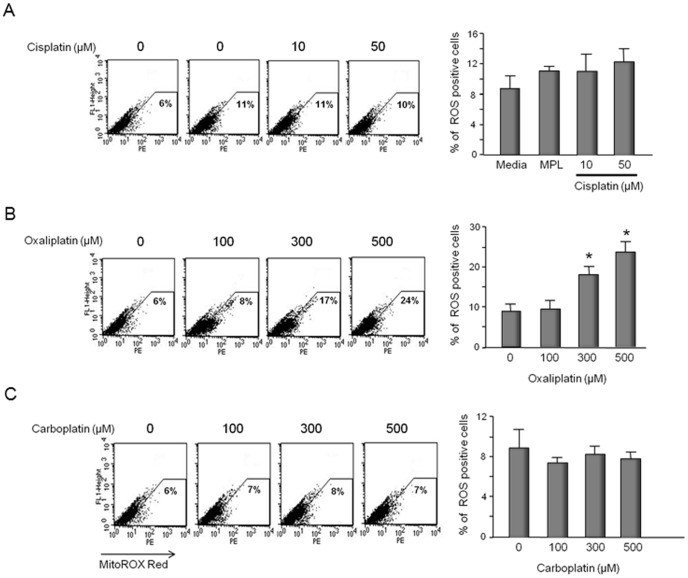
Figure 7. Oxaliplatin, but not cisplatin or carboplatin increase production of mitochondrial ROS in sensory neuronal cultures.
Neuronal cultures were exposed to various concentration of cisplatin (A), oxaliplatin (B), or carboplatin (C) for 24 hours starting on day 11 in culture and mitochondrial ROS measured using MitoSOX red and FACS analysis. The left panels show representative FACS analysis for cells treated with various concentrations of cisplatin (A), oxaliplatin (B), or carboplatin (C) as indicated. The panels on the right show the quantification of data from three independent harvests. Each column represents the mean ± SEM of the percent of superoxide positive cells from cultures treated with various concentrations of cisplatin (A); oxaliplatin (B) or carboplatin (C) as indicated. An asterisk indicates significant difference in the number of superoxide positive cells compared to controls using Student's t-test.

