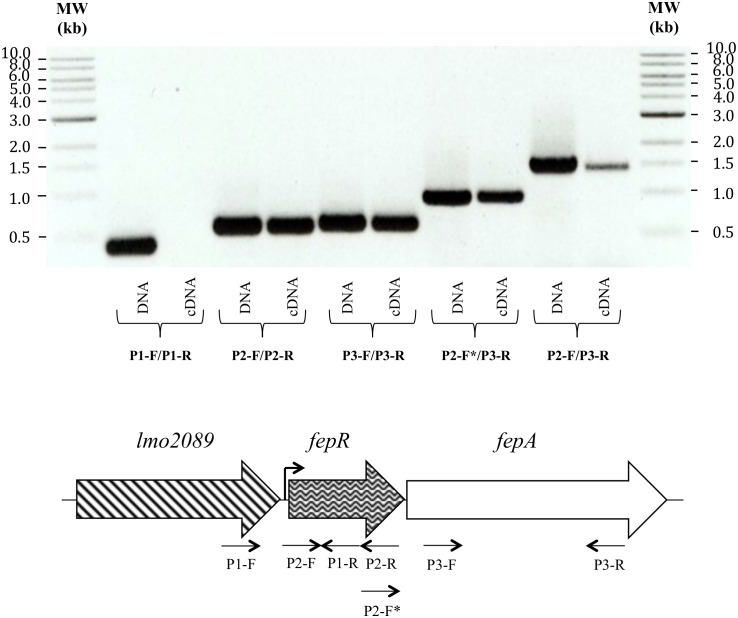
Figure 4. Agarose gel electrophoresis showing PCR products corresponding to transcripts of fepR and fepA genes.
Different sets of primers were designed to amplify specific regions of fepR (P2-F/P2-R) or fepA (P3-F/P3-R), the intergenic region (P2-F*/P3-R), the long cotranscript (P2-F/P3-R) and a negative control (P1-F/P1-R) (Table S1). Each PCR amplification was carried out on chromosomal DNA (used as positive control) and on cDNA, as indicated. MW, 1-kb ladder (New England Biolabs, France).

