
Figure 1.
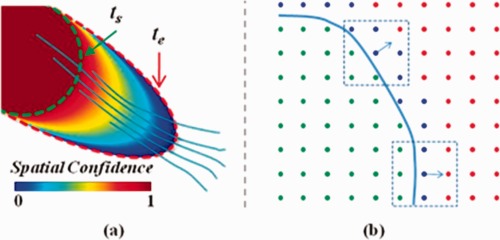
Illustration of the ROI diffusion example. (a) The ROI starts diffusing at t_s (green‐dashed curve) and terminates at t_e (red‐dashed curve), under the guidance of the upper‐left‐to‐lower‐right bundle. Five typical fibers are shown in the figure to represent the bundle. The procedure of ROI diffusion generates the spatial confidence map of the ROI according to the color bar provided. (b) Locations are labeled into three categories: green for inside, blue for active, and red for far‐away. ROI diffusion is always following the upwind normal directions (arrows) of the ROI interface (blue solid curve). [Color figure can be viewed in the online issue, which is available at http://wileyonlinelibrary.com.]