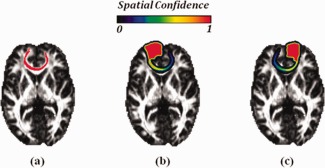
Figure 3.

A real example of ROI diffusion. (a) The bundle connecting SPG‐L and SPG‐R are colored in red and overlaid on the FA slice. The resulted spatial confidence map of SPG‐L and SPG‐R after ROI diffusion following fibers in (a) are shown in (b) and (c), respectively. [Color figure can be viewed in the online issue, which is available at http://wileyonlinelibrary.com.]
