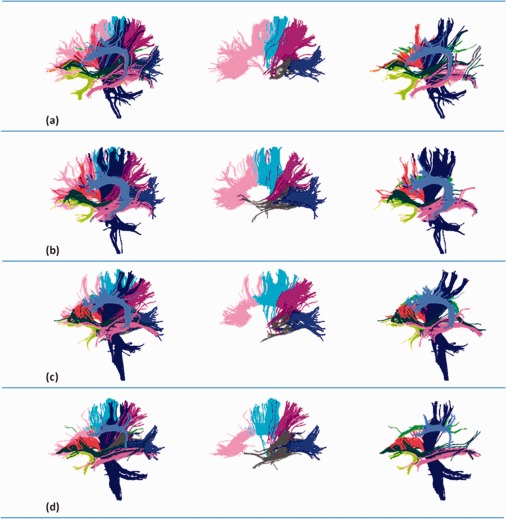
Figure 6.

Clustering results from four randomly selected subjects. Each row corresponds to one subject. The same color coding scheme as Figure 5 is used here for rendering of the individual bundles. Similarly, 12 bundles are displayed in the left column. The corpus callosum bundles (middle column) are shown separately from the other bundles (right column) for clearly visualization. [Color figure can be viewed in the online issue, which is available at http://wileyonlinelibrary.com.]
