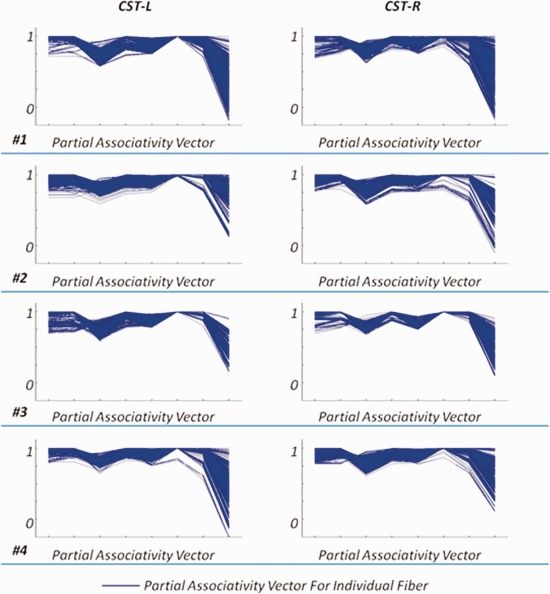
Figure 7.

The partial associativity vectors for CST‐L and CST‐R from four randomly selected subjects. The blue curve indicates the partial associativity vector for each fiber. [Color figure can be viewed in the online issue, which is available at http://wileyonlinelibrary.com.]
