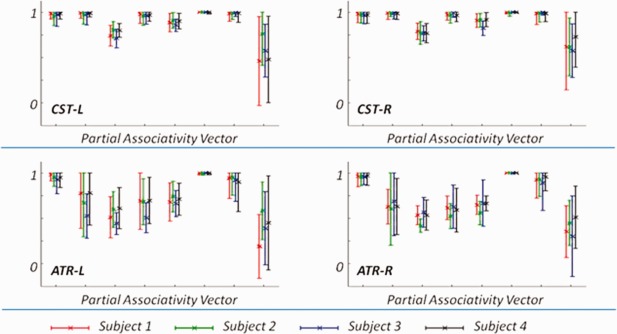
Figure 9.

The mean partial associativity vectors, as well as the standard deviations, for selected bundles (including CST‐L, CST‐R, ATR‐L, and ATR‐R). The different colors mark the four individual subjects listed in Figures 7 and 8. Note that the maximal value of the associativity vector is restricted to 1. [Color figure can be viewed in the online issue, which is available at http://wileyonlinelibrary.com.]
