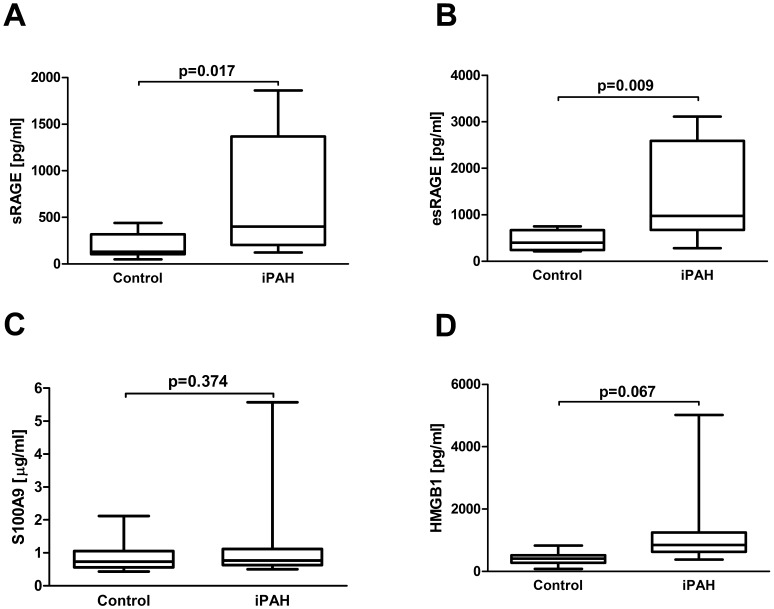
Figure 5. Serum concentrations of RAGE axis molecules in patients with iPAH.
Box plot analysis of serum concentrations of sRAGE (A), esRAGE (B), S100A9 (C) and HMGB1 (D) in patients with iPAH (n = 8) and controls (n = 11). Independent Student’s t-test was used to compare groups. RAGE receptor for advanced glycation endproducts, sRAGE soluble RAGE, esRAGE endogenous secretory RAGE, S100A9 member of S100 family of Ca+ binding proteins, HMGB1 high mobility group box1, iPAH idiopathic pulmonary arterial hypertension.

