
Figure 4. Heatmap of Phyla assignments.

The heatmap reports the normalized values of the taxonomic assignments at phylum level. Each value has been normalized following this criterion: 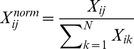 Where Xij is the occurrence of the phyla ‘j’ in the site ‘i’ and N is the number of site in the dataset (in this case 9). Using this transformation each phyla assignment can be compared in all sites independently from its order of magnitude.