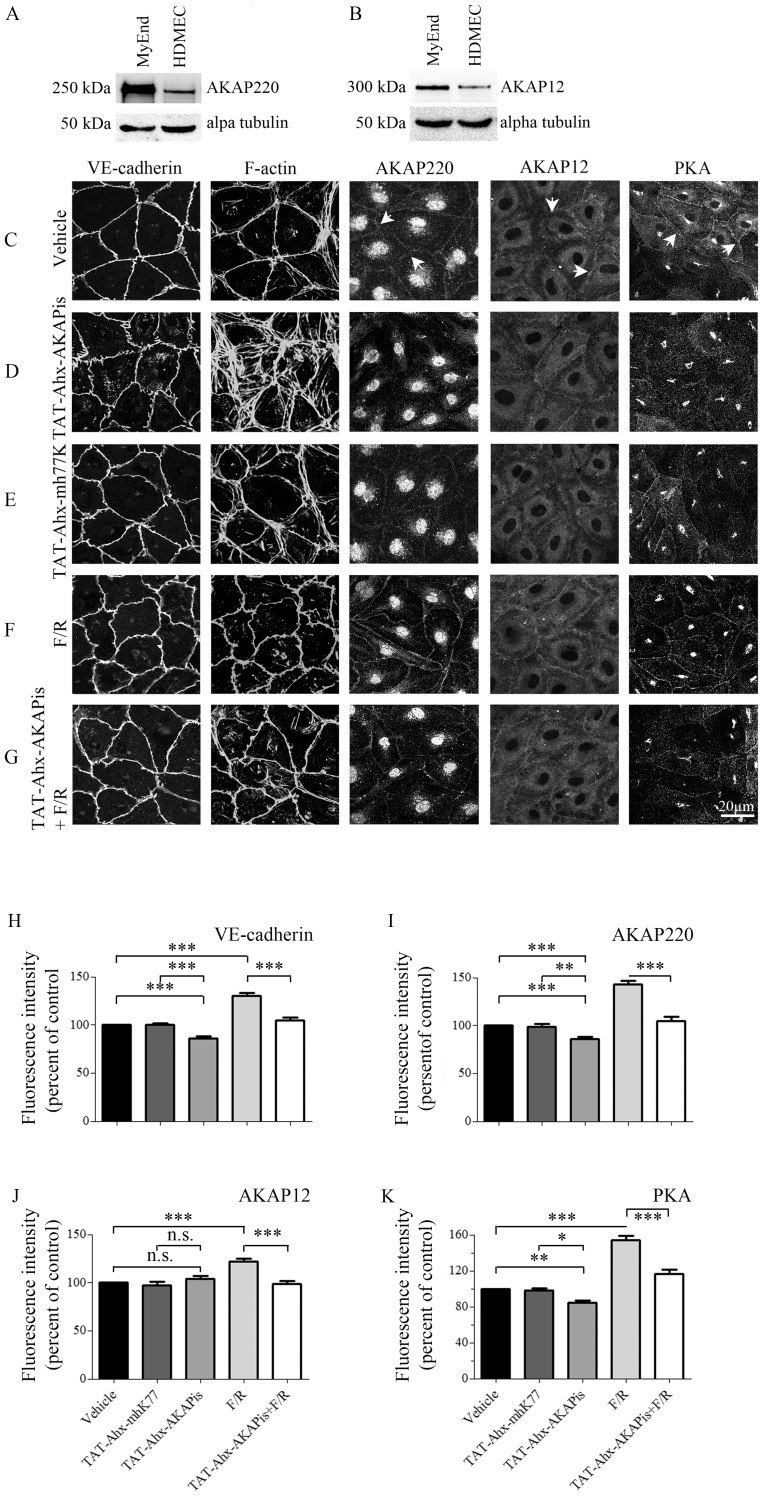
Figure 2. Effects of PKA compartmentalization on adherens junctions, actin cytoskeleton and AKAP organization.
To determine the AKAPs protein expression profile, equal amounts of MyEnd and HDMEC cell lysates (20 µg per line) were subjected to WB analysis. The expression patterns of AKAP220 (A) and AKAP12 (B) were analyzed. Loading was controlled by alpha tubulin expression. Data are representative of three or more independent experiments (N≥3). In addition, HDMEC monolayers were treated for 1 hour either with vehicle, TAT-Ahx-AKAPis, TAT-Ahx-mhK77, F/R or with a combination of 1 hour TAT-Ahx-AKAPis pretreatment followed by 1 hour F/R application. The distributions of VE-cadherin, PKA, AKAP220 and AKAP12 were assayed by immunofluorescence. Additionally, ALEXA-488-conjugated phalloidin was used for visualization of F-actin. (C) Under control condition, VE-cadherin displayed slightly interdigitated but continuous staining along cell borders, and the actin cytoskeleton was preferentially organized cortically. The staining of AKAP220, AKAP12 and PKA was detectable at cell borders (arrows). (D) In clear contrast, exposure to TAT-Ahx-AKAPis increased interdigitations and significantly reduced the intensity of VE-cadherin staining. Profound reorganization of the actin cytoskeleton was paralleled by substantial reduction of AKAP220 and PKA, but not of AKAP12 membrane staining. (E) However, cell monolayers incubated with TAT-Ahx-mhK77 showed immunofluorescence staining similar to control for all proteins under investigation. (F) Not surprisingly, F/R treatment resulted in pronounced and linearized VE-cadherin appearance, intensified cortical actin cytoskeleton, and pronounced membrane staining for AKAP220, AKAP12 and PKA compared to control conditions. (G) 1 hour pre-incubation with TAT-Ahx-AKAPis followed by 1 hour treatment with F/R resulted in monolayers largely similar to controls, but not to F/R incubation alone. Images are representative of three or more independent experiments (N ≥3). Scale bar = 20 µm. The above presented data were confirmed by quantification of signal intensity distribution at cell borders. (H–K) demonstrates the mean intensity peak observed at cell borders (n≥15). *** p≤0.001, ** p≤0.01, * p≤0.05, indicate statistically significant difference between examined groups; n.s., not significant.

