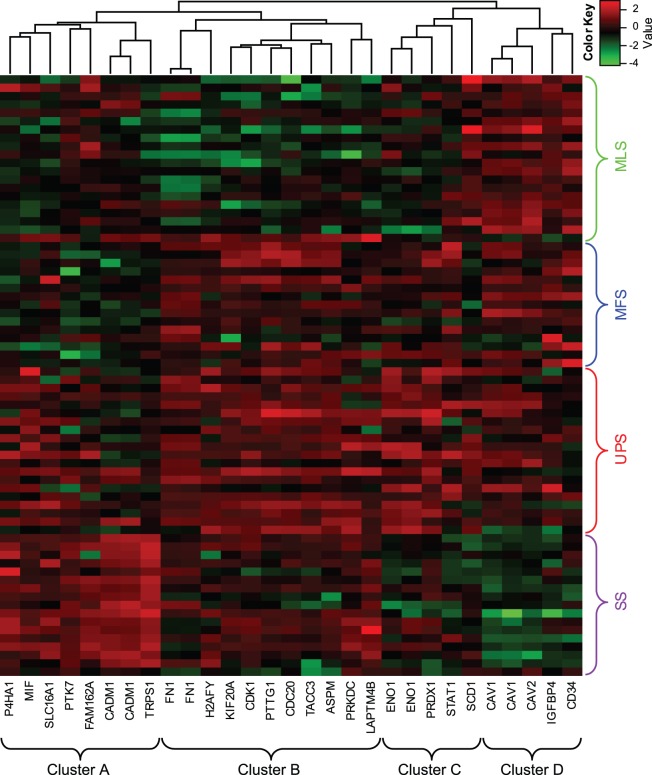
Figure 3. Heatmap and hierarchical clustering analyses.
Twenty-nine probe sets were extracted using a simulation based on the permutation test (with adjusted p<0.05). The 29 probe sets were roughly divided into 4 clusters (clusters A–D). Columns represent probe sets, and rows represent samples. Red and green indicate high and low expression, respectively. UPS: undifferentiated pleomorphic sarcoma, MLS: myxoid liposarcoma, SS: synovial sarcoma, MFS: myxofibrosarcoma.

