
Figure 7. The Kaplan-Meier curve and the logrank test for STAT1 in UPS patients.
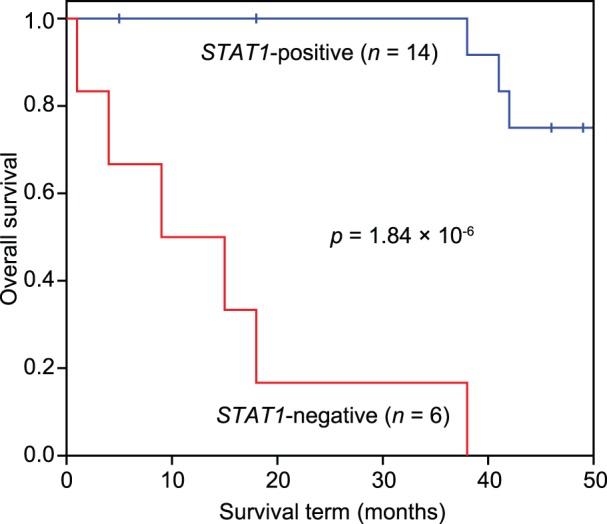
The STAT1-positive group (STAT1 expression level >4871.5) consisted of 14 patients (blue line), and the STAT1-negative group consisted of 6 patients (red line). A hazard ratio (exp(B) = 30.2) was calculated using the Cox proportional hazards model.