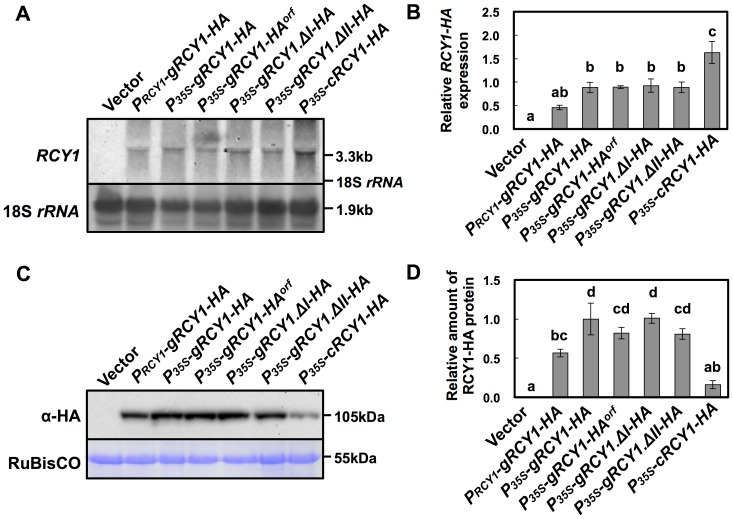
Figure 5. Detection of HA-epitope-tagged RCY1 protein and RCY1 transcript in N. benthamianaleaves transiently expressing a series of RCY1-HAconstructs under control of the RCY1 or CaMV 35S promoters.
RCY1 transcripts in N. benthamiana leaves agro-infiltrated withPRCY1-gRCY1-HA, P35S-gRCY1-HA, P35S-gRCY1-HAorf, P35S-gRCY1.ΔI-HA, P35S-gRCY1.ΔII-HA, or P35S-cRCY1-HA were detected by northern hybridization. pRI201-AN (Vector) was used as an empty-vector control for agro-infiltration. As an internal control for RNA sample quantities, 18S rRNA is shown (A). Relative amounts of RCY1transcripts in each line were measured by quantitative RT-PCR. EFαgene expression was used as a standard for normalization of RCY1expression (B). HA-epitope-tagged RCY1 protein (α-HA) in N. benthamiana leaves transiently expressing PRCY1-gRCY1-HA, P35S-gRCY1-HA, P35S-gRCY1-HAorf, P35S-gRCY1.ΔI-HA, P35S-gRCY1.ΔII-HA, or P35S-cRCY1-HA was immunologically detected using anti-HA monoclonal antibody. As an internal control for protein sample quantities, the large subunit of RuBisCO was visualized by staining with CBB (C). RCY1-HA protein amounts in each line were quantified by band intensity using Quantity One software. For all experiments, four independent plants transiently expressing each vector construct were analyzed (D). The averages of relative RCY1 transcript amounts ±SE are shown in B and D. In A and C, representative photographs are shown. The size of each band and the position of 18S rRNA were shown at right side of the panels. Data were subjected to analysis of variance and treatment means were compared by Tukey's test. Different letters indicate a statistically significant difference in the relative amount of RCY1 transcript (n = 4, P<0.05).

