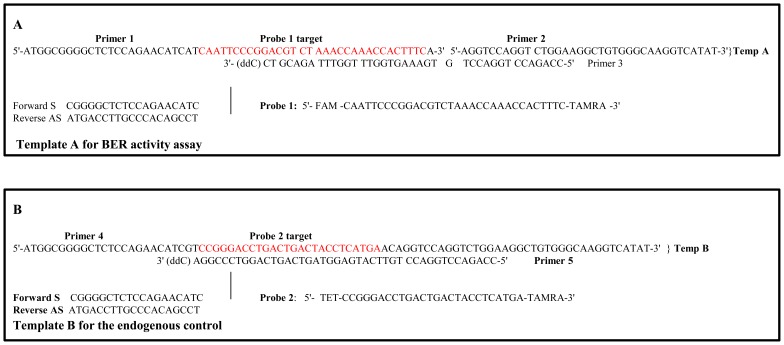
Figure 1. Templates for qPCR-based BER activity assay.
Whole cell extracts were isolated from brain tissue and exposed to a template DNA containing a single nucleotide lesion (A) and control template (B). BER activity was calculated by comparing the ΔΔCt values (Ct is the number of cycles required for the fluorescent signal to cross the threshold) of the repaired and control templates.

