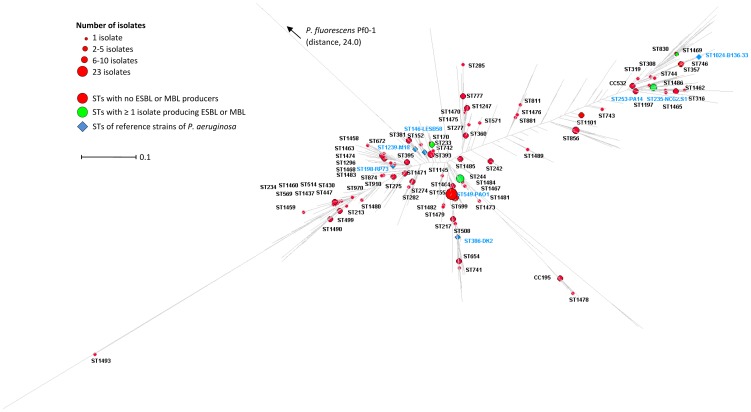
Figure 2. Distribution of the STs and CCs of the 184 clinical isolates of Pseudomonas aeruginosa isolated in West and Central Africa on a dendrogram built with the data all known STs (n = 1595).
STs without any isolates producing ESBL or MBL were represented with red spots. STs represented by ≥1 isolate producing ESBL or MBL were represented with green spots. STs of reference isolates are represented with blue diamonds. The dendrogram is based on the alignment of the concatenated sequences of the acsA, aroE, guaA, mutL, nuoD, ppsA and trpE genes (forming an artificial 2,882-bp sequence) of the 1595 STs of the P. aeruginosa MLST database in July 2013 [11]. See Material and methods section for details.

