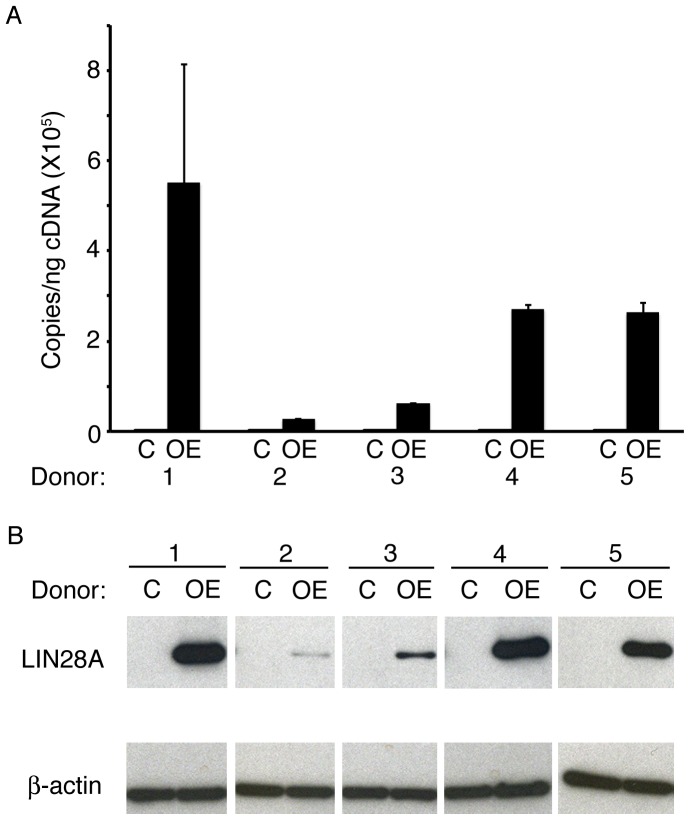
Figure 1. LIN28A over-expression in human sickle erythroblasts was confirmed by (A) Q-RT-PCR quantitation of copy number per nanogram of complementary DNA (cDNA) (copies/ng cDNA) and (B) Western blot analysis.
Analyses were performed at culture day 14. Open bars represent control and black bars represent LIN28A over-expression. C: empty vector control; OE: LIN28A over-expression.

