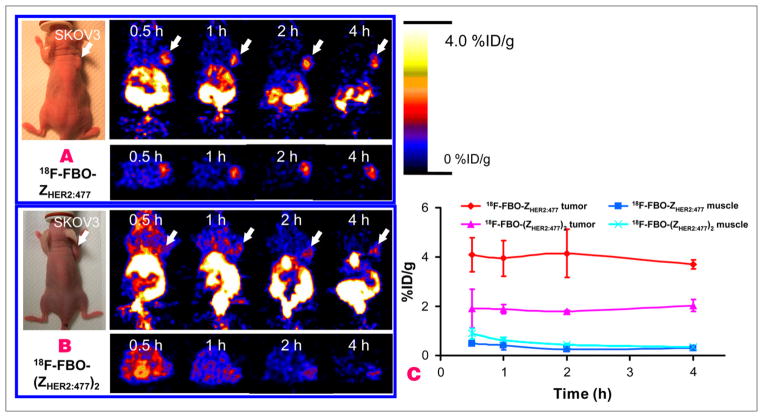
FIGURE 7.
Decay-corrected coronal (top) and transaxial (bottom) small-animal PET images of nude mice bearing SKOV3 tumors on right shoulder at 0.5, 1, 2, and 4 h after tail vein injection of 18F-FBO-ZHER2:477 (A) and 18F-FBO-(ZHER2:477)2 (B). Arrows indicate locations of tumors. (C) Tumor and muscle time–activity curves derived from multiple-time-point small-animal PET images of mice bearing SKOV3 tumors. Data are shown as mean ± SD %ID/g (n = 3).

