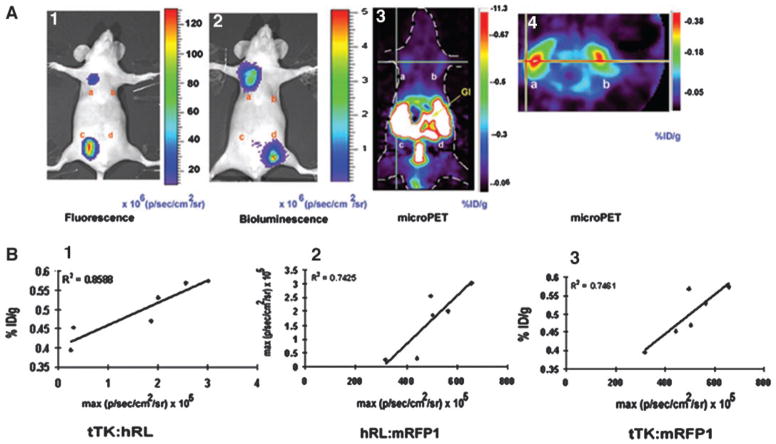
Fig. 3.
Results of imaging living mice. A, fluorescence, bioluminescence, and micro-positron emission tomography (PET) imaging of hrl-mrfp-ttk expression in the same living nude mouse. Ten million 293T cells transiently expressing the CMV-hrl-mrfp-ttk, CMV-ttk, CMV-mrfp1, and CMV-hrl plasmids were implanted s.c. at four sites on the ventral side of a nude mouse and imaged the next day for fluorescence/bioluminescence and PET using a cooled charge-coupled device (CCD) camera and microPET, respectively. Fluorescence imaging was performed by placing the mouse in a CCD camera for 1 s, and a fluorescence image was acquired with a excitation filter at 500–550 nm and an emission filter at 575– 650 nm. Cells expressing the fusion (A.1, a) and mrfp1 (A.1, c) genes showed fluorescence, and the signal is recorded as maximum photons/sec/cm2/sr (A.1). The same mouse was then scanned in the CCD camera for bioluminescence after injection of coelenterazine via tail vein, and bioluminescence signal was found in cells expressing the fusion (A.2, a) and hrl (A.2, d) and recorded as maximum photons/sec/cm2/sr (A.2). After the optical scan, the same mouse was imaged by microPET using 9-(4-[18F]fluoro-3-hydroxymethylbutyl)guanine (FHBG). Cells expressing the fusion reporter gene (A.3, a and A.4, a) and ttk gene (A.3, b and A.4, b) showed FHBG accumulation in coronal section (A.3) and trans-axial section (A.4). Nonspecific accumulation of tracer was found in the gastrointestinal tracts and bladder (attributable to clearance of FHBG; A.3). B, in vivo correlation of hrl, mrfp1, and ttk gene expression exhibited by four clones of 293T cells stably but differentially expressing the hrl-mrfp-ttk fusion. Ten million cells of each clone were implanted on the axillary regions of the ventral side of three nude mice (two clones in each mouse), and after 24 h, mice were imaged by the cooled CCD camera and microPET. Plots of percentage of ID/g versus bioluminescence [expressed as maximum photons/second/centimeter2/steradian (p/s/cm2/sr); B.1], bioluminescence versus fluorescence (both expressed as maximum p/s/cm2/sr; B.2), and percentage of ID/g versus fluorescence (expressed as maximum p/s/cm2/sr; B.3) were obtained from the regions of interest drawn over the regions of cell implantation. Each of the six data points of each plot represents region of interest data from the fluorescence, bioluminescence, and microPET images of the same living mouse, with a total of three mice (2 points/mouse)

